## Scatter Plot: Audio Model Performance vs. Parameter Count
### Overview
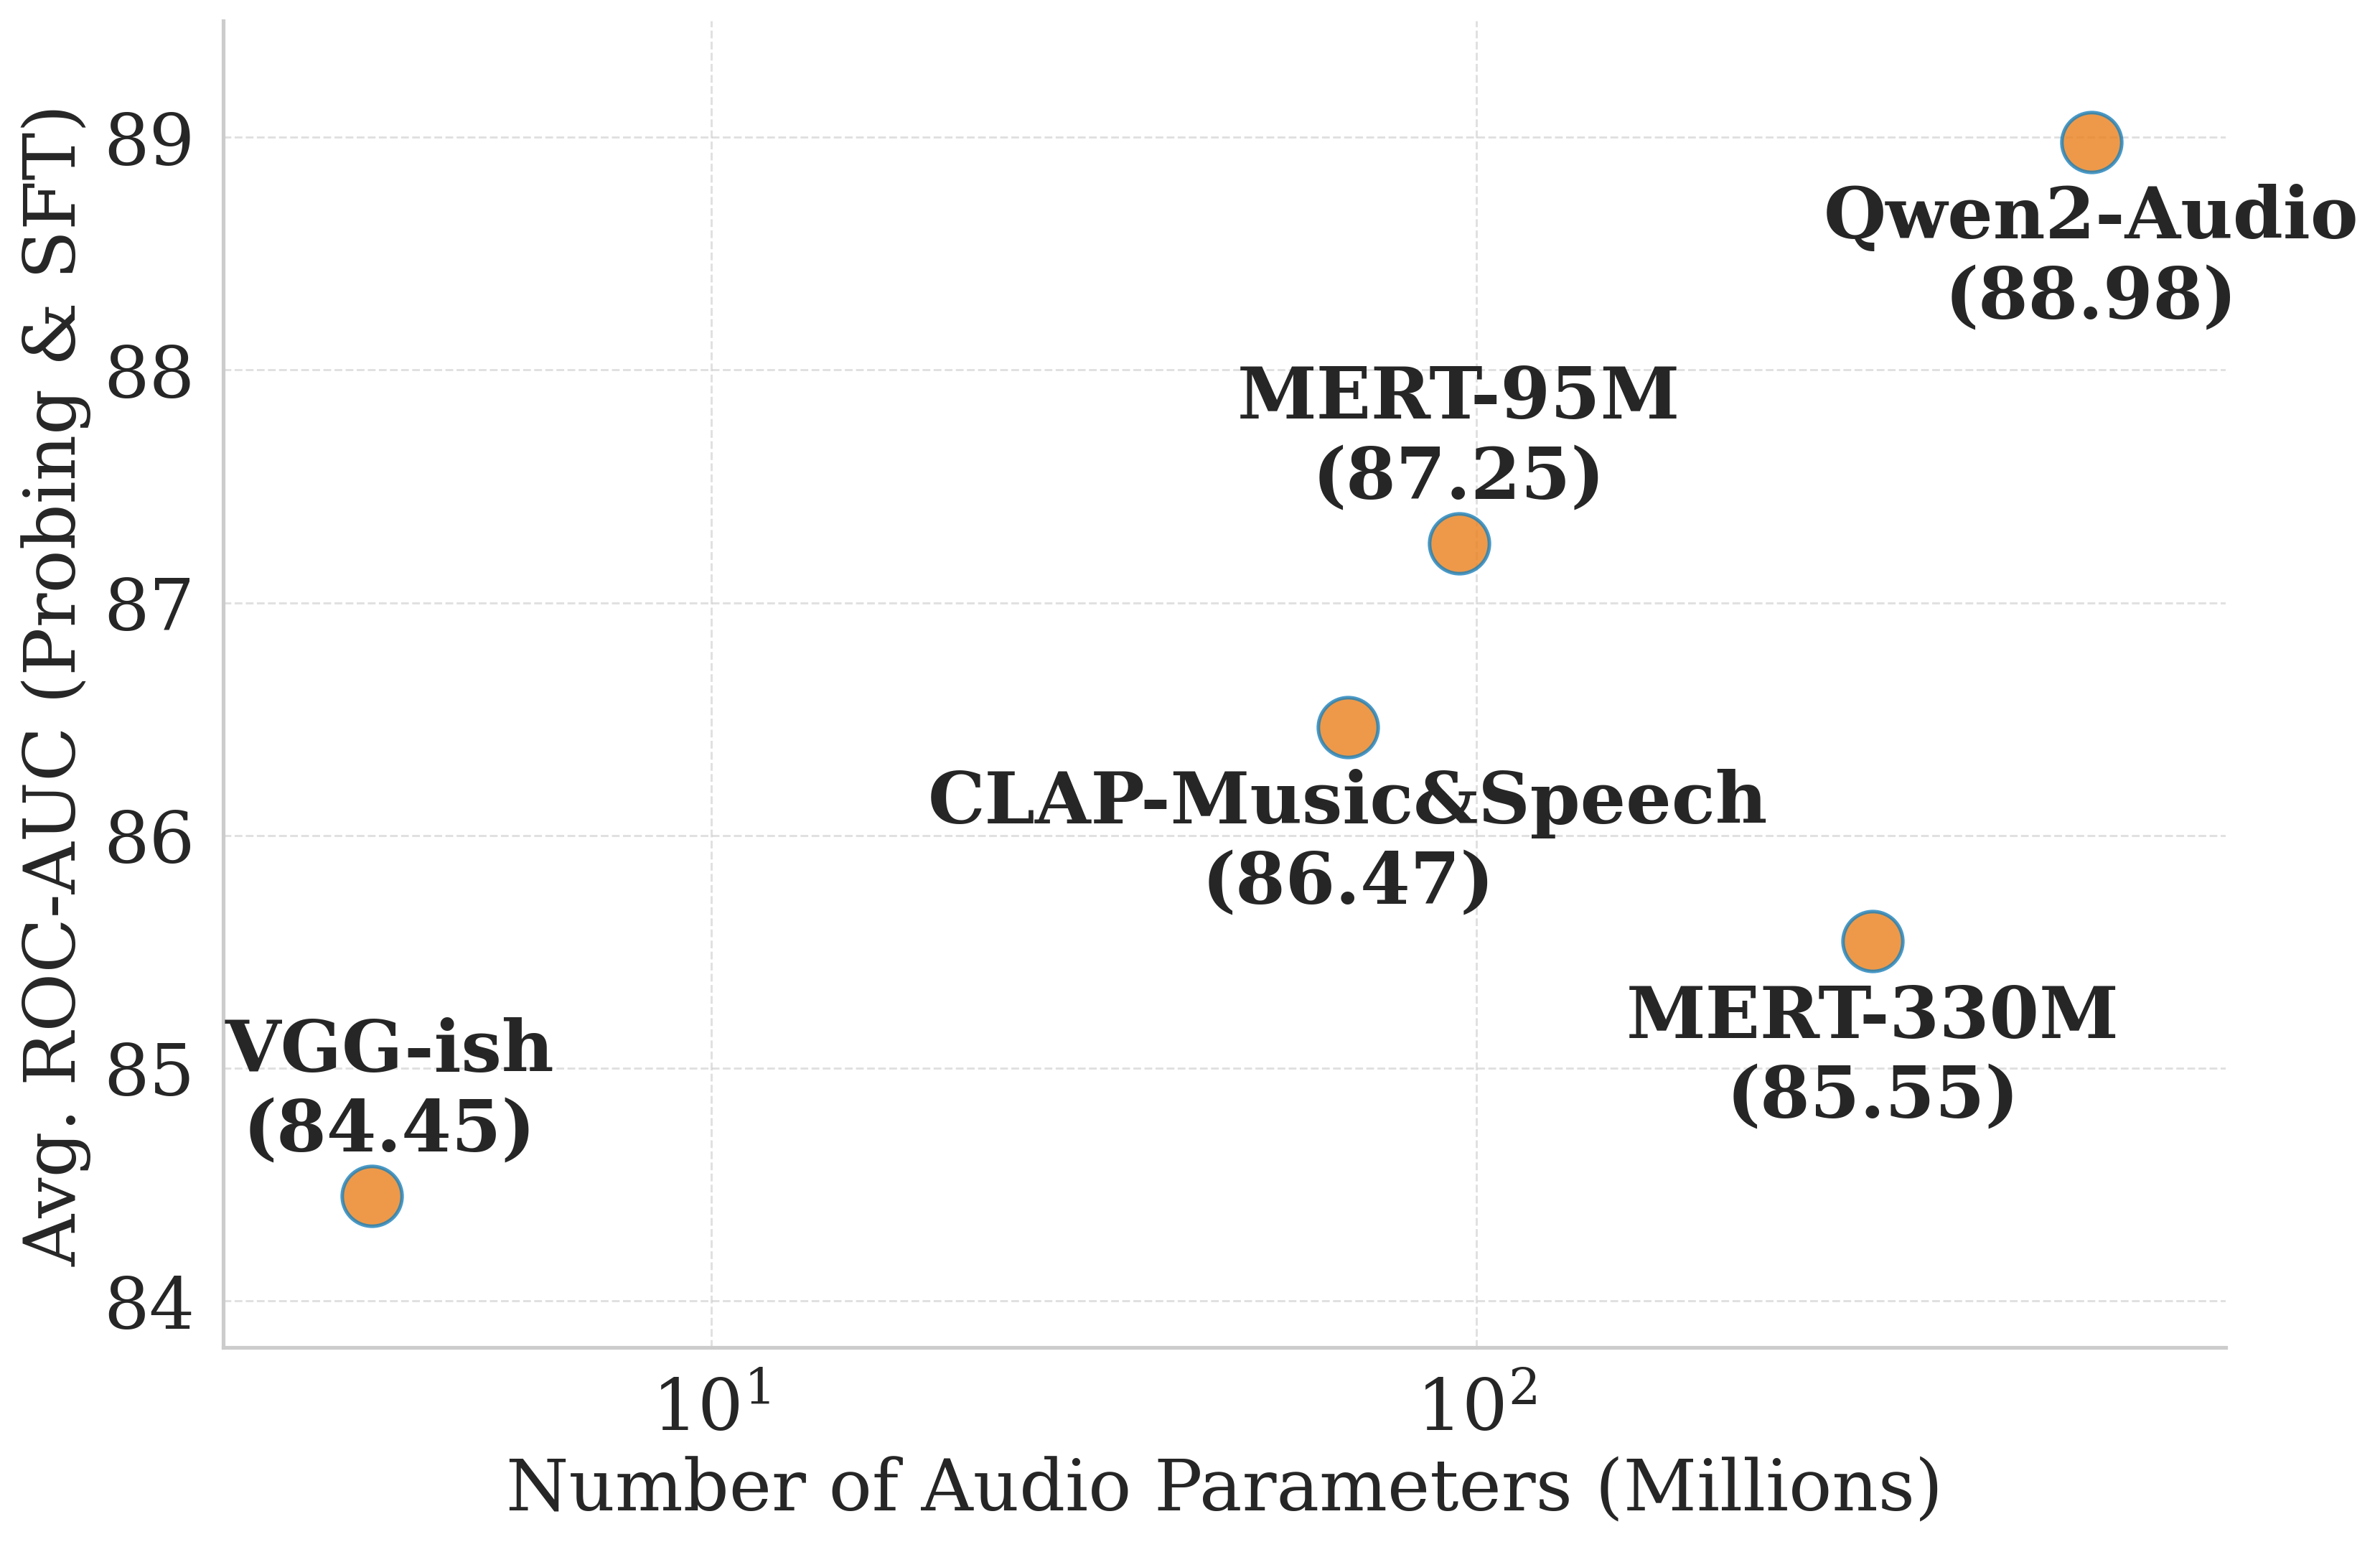
The image is a scatter plot comparing audio models' average ROC-AUC (Probing & SFT) against their number of audio parameters (in millions). The x-axis uses a logarithmic scale, and the y-axis ranges from 84 to 89. Five data points are plotted, each labeled with model names and their corresponding ROC-AUC values.
### Components/Axes
- **X-axis**: "Number of Audio Parameters (Millions)" (logarithmic scale, labeled ticks at 10¹, 10², 10³).
- **Y-axis**: "Avg. ROC-AUC (Probing & SFT)" (linear scale, labeled ticks from 84 to 89).
- **Data Points**: Five orange circles with blue outlines, each annotated with model names and ROC-AUC values in parentheses.
- **Legend**: Not explicitly visible in the image, but data points are color-coded (orange with blue outlines).
### Detailed Analysis
1. **VGG-ish**
- Position: Bottom-left (10¹ parameters).
- ROC-AUC: 84.45.
2. **CLAP-Music&Speech**
- Position: Center-left (10² parameters).
- ROC-AUC: 86.47.
3. **MERT-330M**
- Position: Right-center (10².5 parameters, ~316 million).
- ROC-AUC: 85.55.
4. **MERT-95M**
- Position: Center-right (10² parameters).
- ROC-AUC: 87.25.
5. **Qwen2-Audio**
- Position: Top-right (10³ parameters, ~1,000 million).
- ROC-AUC: 88.98.
### Key Observations
- **Trend**: ROC-AUC generally increases with parameter count, but exceptions exist (e.g., MERT-330M has higher parameters than CLAP-Music&Speech but lower ROC-AUC).
- **Outliers**:
- **MERT-330M**: Lower ROC-AUC (85.55) despite more parameters than CLAP-Music&Speech (86.47).
- **Qwen2-Audio**: Highest ROC-AUC (88.98) with the most parameters (1,000 million).
- **Logarithmic Scale**: The x-axis compresses parameter ranges, emphasizing relative differences (e.g., 10¹ to 10² spans 90 million parameters).
### Interpretation
The data suggests a **positive correlation** between parameter count and ROC-AUC, but **diminishing returns** are evident. For example:
- **MERT-95M** (100M parameters, 87.25 ROC-AUC) outperforms **CLAP-Music&Speech** (100M parameters, 86.47 ROC-AUC), indicating architectural efficiency.
- **MERT-330M** (316M parameters, 85.55 ROC-AUC) underperforms smaller models, highlighting potential inefficiencies in scaling.
- **Qwen2-Audio** achieves near-peak performance (88.98 ROC-AUC) with 1,000M parameters, suggesting optimal scaling for this architecture.
The logarithmic x-axis emphasizes that parameter growth is exponential, yet ROC-AUC improvements are linear, implying **diminishing returns** at scale. This aligns with common machine learning trends where larger models require disproportionate resources for marginal gains.