## Line Chart: Historical Frequency of "Verifiability" vs. "Falsifiability" (1870-2000)
### Overview
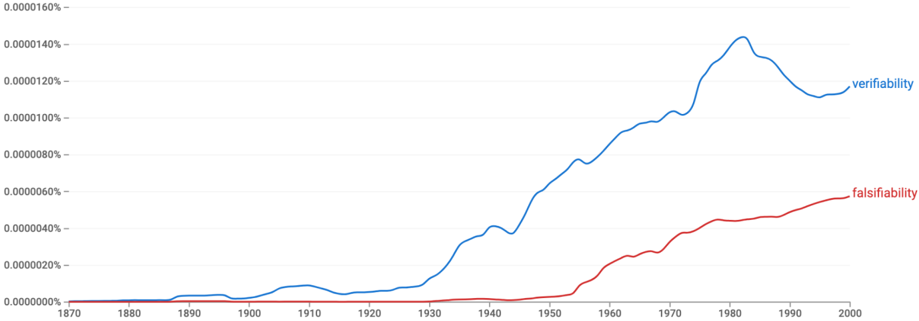
This image is a line chart displaying the relative frequency of two terms, "verifiability" and "falsifiability," over a 130-year period from 1870 to 2000. The chart suggests a comparison of the prevalence of these concepts in a corpus of text (likely books or academic literature) over time. The blue line for "verifiability" shows a significantly higher and more volatile frequency compared to the red line for "falsifiability," which demonstrates a later, steadier rise.
### Components/Axes
* **Chart Type:** Dual-line time series chart.
* **X-Axis (Horizontal):** Represents time in years. The axis is labeled with major tick marks every 10 years, starting at **1870** and ending at **2000**. The labels are: 1870, 1880, 1890, 1900, 1910, 1920, 1930, 1940, 1950, 1960, 1970, 1980, 1990, 2000.
* **Y-Axis (Vertical):** Represents a percentage value, likely the frequency of the term's occurrence relative to all words in the corpus for a given year. The axis is labeled with values in scientific notation format, from **0.0000000%** at the bottom to **0.0000160%** at the top. The increments are 0.0000020%. The specific labels are: 0.0000000%, 0.0000020%, 0.0000040%, 0.0000060%, 0.0000080%, 0.0000100%, 0.0000120%, 0.0000140%, 0.0000160%.
* **Legend:** Positioned on the right side of the chart, aligned with the end of the data lines.
* A **blue line** segment is labeled **"verifiability"**.
* A **red line** segment is labeled **"falsifiability"**.
### Detailed Analysis
**Trend Verification & Data Points:**
1. **"Verifiability" (Blue Line):**
* **Trend:** The line starts near zero in 1870. It shows a very gradual, shallow increase until approximately 1930. From 1930 to 1980, it exhibits a strong, sustained upward trend with some minor fluctuations, reaching its peak. After 1980, the line shows a notable decline until around 1995, followed by a slight recovery towards 2000.
* **Approximate Data Points:**
* 1870-1920: Hovers just above 0.0000000%, with a minor bump around 1910 (~0.0000010%).
* 1930: Begins a steeper ascent from ~0.0000020%.
* 1950: Reaches ~0.0000060%.
* 1960: ~0.0000090%.
* 1970: ~0.0000105%.
* **Peak (~1980):** Reaches its maximum value of approximately **0.0000145%**.
* 1990: Declines to ~0.0000120%.
* 2000: Ends at approximately **0.0000120%**.
2. **"Falsifiability" (Red Line):**
* **Trend:** The line remains extremely flat and near zero for the first 80 years (1870-1950). It begins a clear, steady, and nearly linear upward trend around 1950, continuing through to 2000 without any significant peaks or declines.
* **Approximate Data Points:**
* 1870-1950: Essentially at **0.0000000%**.
* 1960: Begins to rise visibly, reaching ~0.0000010%.
* 1970: ~0.0000025%.
* 1980: ~0.0000040%.
* 1990: ~0.0000050%.
* 2000: Ends at its highest point, approximately **0.0000055%**.
### Key Observations
1. **Magnitude Disparity:** The frequency of "verifiability" is consistently higher than that of "falsifiability" throughout the entire period shown. At its peak, "verifiability" is over 2.5 times more frequent than "falsifiability" is at its own peak.
2. **Temporal Lag:** There is a significant lag of approximately 80 years between the initial, slow rise of "verifiability" (starting ~1900-1910) and the beginning of the rise of "falsifiability" (starting ~1950).
3. **Divergent Post-Peak Behavior:** After reaching its peak around 1980, "verifiability" enters a period of decline, whereas "falsifiability" continues its steady, uninterrupted increase through the end of the chart's timeline.
4. **Correlation with Historical Context:** The sharp rise in "verifiability" from the 1930s onward and the later emergence of "falsifiability" in the 1950s align with major developments in the philosophy of science, notably the logical positivism movement (emphasizing verification) and Karl Popper's subsequent work (introducing falsification as a central criterion).
### Interpretation
This chart visually narrates a shift in intellectual discourse. The data suggests that the concept of **verifiability** became a dominant topic of discussion in the mid-20th century, peaking around 1980. This likely reflects the influence of the logical positivist tradition, which held that for a statement to be meaningful, it must be empirically verifiable.
The later, steady rise of **falsifiability** from the 1950s onward indicates its growing importance as a counter-concept. This corresponds directly with the publication and dissemination of Karl Popper's ideas, which argued that the demarcation of science from non-science lies not in verifiability but in the capacity to be falsified. The continued rise of "falsifiability" even as "verifiability" declines after 1980 may suggest a lasting impact of Popperian thought on scientific and philosophical vocabulary, potentially marking a paradigm shift in how the criteria for scientific knowledge are discussed. The chart does not measure the *validity* of these concepts, but rather their *prominence* in the textual record.