## Line Graph: Verifiability vs. Falsifiability Over Time
### Overview
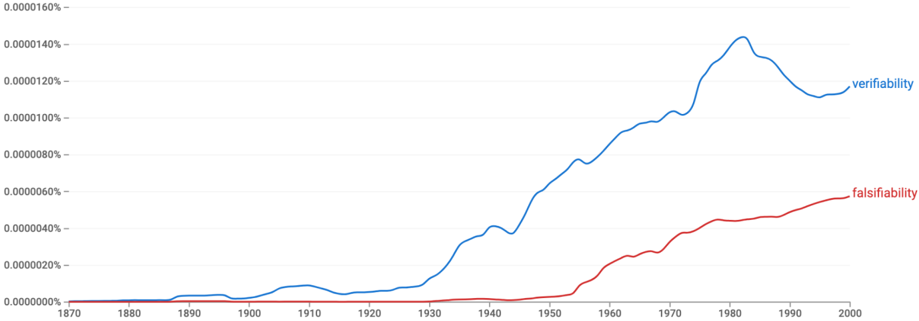
The image is a line graph depicting two trends over time: "verifiability" (blue line) and "falsifiability" (red line). The x-axis represents years from 1870 to 2000, while the y-axis represents a percentage scale ranging from 0.00000000% to 0.00001600%. Both lines originate near zero in 1870 but diverge significantly in their trajectories over the 20th century.
### Components/Axes
- **X-axis**: Labeled "Years," spanning 1870 to 2000 in 10-year increments.
- **Y-axis**: Unlabeled but scaled from 0.00000000% to 0.00001600% in 0.00000200% increments.
- **Legend**: Located on the right side of the graph. Blue corresponds to "verifiability," and red corresponds to "falsifiability."
- **Lines**:
- **Blue (Verifiability)**: Starts near zero in 1870, remains flat until ~1930, then rises gradually until peaking around 1985 (~0.00001400%), followed by a slight decline to ~0.00001200% by 2000.
- **Red (Falsifiability)**: Remains near zero until ~1960, then increases steadily to ~0.00000600% by 2000.
### Detailed Analysis
- **Verifiability (Blue Line)**:
- **1870–1930**: Near-zero values (~0.00000000%–0.00000020%).
- **1930–1985**: Gradual increase from ~0.00000020% to ~0.00001400%.
- **1985–2000**: Decline from ~0.00001400% to ~0.00001200%.
- **Falsifiability (Red Line)**:
- **1870–1960**: Near-zero values (~0.00000000%–0.00000010%).
- **1960–2000**: Steady rise from ~0.00000010% to ~0.00000600%.
### Key Observations
1. **Verifiability** shows a delayed but pronounced increase starting in the 1930s, peaking in the 1980s, then stabilizing.
2. **Falsifiability** remains negligible until the 1960s, after which it rises consistently, doubling every ~20 years.
3. The y-axis scale is extremely small, suggesting the metric being measured is either highly specialized or normalized to a specific context (e.g., scientific rigor, methodological adoption).
### Interpretation
- **Verifiability**: The mid-20th-century rise may reflect advancements in scientific methodology, technology, or institutional practices (e.g., peer review, data standardization). The post-1985 decline could indicate a shift toward skepticism or increased complexity in verification processes.
- **Falsifiability**: The steady rise aligns with philosophical emphasis on testability (Karl Popper’s criterion for scientific theories). Its growth may reflect broader adoption of critical thinking, empirical validation, or regulatory frameworks requiring falsifiability in fields like science, law, or policy.
- **Relationship**: The inverse relationship between the two trends suggests a trade-off: as falsifiability (rigorous testing) increases, verifiability (absolute confirmation) may decline due to heightened scrutiny or recognition of uncertainty.
### Notable Anomalies
- The abrupt rise in falsifiability post-1960 contrasts with verifiability’s gradual growth, hinting at a paradigm shift in how knowledge is validated.
- The y-axis scale’s extreme smallness warrants clarification—it may represent a niche metric (e.g., error rates, reproducibility scores) rather than general public understanding.
### Conclusion
The graph illustrates a historical tension between verification and falsification in scientific or methodological discourse. The divergence of the two lines underscores evolving epistemological priorities, with falsifiability gaining prominence as a cornerstone of modern scientific integrity.