## Scatter Plot: Nutrition Confidence vs. Target Length
### Overview
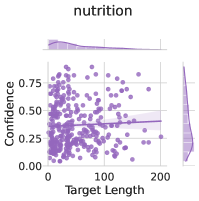
The image is a scatter plot titled "nutrition". It displays the relationship between "Target Length" on the x-axis and "Confidence" on the y-axis. The plot includes a regression line and marginal distributions for both variables. The data points are clustered in the lower-left region, with a slight upward trend indicated by the regression line.
### Components/Axes
* **Title:** nutrition
* **X-axis:** Target Length
* Scale: 0 to 200, with tick marks at approximately 0, 100, and 200.
* **Y-axis:** Confidence
* Scale: 0.00 to 0.75, with tick marks at 0.00, 0.25, 0.50, and 0.75.
* **Data Points:** Purple dots representing individual data points.
* **Regression Line:** A purple line indicating the linear relationship between Target Length and Confidence.
* **Marginal Distributions:** Histograms along the top (Target Length) and right side (Confidence) showing the distribution of each variable.
### Detailed Analysis
* **Data Point Distribution:** The majority of data points are concentrated in the lower-left corner of the plot, indicating that most targets have shorter lengths and lower confidence scores.
* **Regression Line:** The regression line has a slight positive slope, suggesting a weak positive correlation between Target Length and Confidence. As Target Length increases, Confidence tends to increase slightly.
* **Marginal Distribution (Target Length):** The distribution of Target Length is skewed to the right, with a peak around lower values and a long tail extending to higher values.
* **Marginal Distribution (Confidence):** The distribution of Confidence appears to be bimodal, with peaks around lower and mid-range values.
* **Specific Data Points:**
* There are many points with Target Length between 0 and 50 and Confidence between 0.00 and 0.25.
* There are fewer points with Target Length greater than 150 and Confidence greater than 0.50.
### Key Observations
* The relationship between Target Length and Confidence is weakly positive.
* Shorter targets tend to have lower confidence scores.
* The data is clustered, indicating that certain combinations of Target Length and Confidence are more common.
### Interpretation
The scatter plot suggests that there is a slight positive correlation between the length of a target and the confidence associated with it. However, the correlation is weak, and the majority of data points are clustered in the lower-left corner, indicating that shorter targets with lower confidence scores are more prevalent. The marginal distributions provide additional context, showing the distribution of each variable independently. The bimodal distribution of confidence suggests that there may be two distinct groups of targets with different confidence levels. Overall, the plot provides insights into the relationship between target length and confidence, but further analysis may be needed to understand the underlying factors driving this relationship.