## Scatter Plot: Nutrition Data Analysis
### Overview
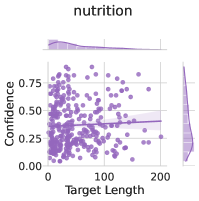
The image displays a scatter plot titled "nutrition," visualizing the relationship between "Target Length" (x-axis) and "Confidence" (y-axis). Purple data points are distributed across the plot, with a faint upward-sloping trend line. Density plots for both axes are overlaid at the top and right edges, respectively. The legend is positioned at the top-right corner, confirming the data points are represented by purple markers.
### Components/Axes
- **X-axis (Target Length)**: Labeled "Target Length," scaled from 0 to 200 in increments of 50.
- **Y-axis (Confidence)**: Labeled "Confidence," scaled from 0.00 to 0.75 in increments of 0.25.
- **Legend**: Located at the top-right, indicating purple markers represent data points.
- **Density Plots**:
- Top: Horizontal density plot for "Target Length," peaking around 100–150.
- Right: Vertical density plot for "Confidence," peaking around 0.3–0.5.
### Detailed Analysis
- **Trend Line**: A faint upward-sloping line suggests a weak positive correlation between "Target Length" and "Confidence." The slope appears to increase by approximately 0.01–0.05 per unit increase in "Target Length."
- **Data Points**:
- Confidence values range from ~0.00 to ~0.75, with most points clustered between 0.25 and 0.50.
- At "Target Length" = 0, confidence is ~0.25.
- At "Target Length" = 100, confidence averages ~0.35.
- At "Target Length" = 200, confidence averages ~0.45.
- **Density Distributions**:
- "Target Length" is moderately spread, with a peak density between 100–150.
- "Confidence" is concentrated between 0.3–0.5, with fewer extreme values.
### Key Observations
1. **Weak Positive Correlation**: The trend line indicates a slight increase in confidence with longer target lengths, but variability is significant.
2. **Confidence Distribution**: Most data points fall within the 0.25–0.50 confidence range, suggesting moderate certainty across the dataset.
3. **Target Length Distribution**: The majority of "Target Length" values cluster around 100–150, with fewer extremes.
### Interpretation
The data suggests that longer "Target Length" values are associated with marginally higher confidence, though the relationship is not strong. The density plots reveal that both variables are moderately concentrated in mid-range values, implying a potential focus on mid-sized targets in the dataset. The weak trend line and high variability indicate that factors beyond "Target Length" may influence confidence, or that the dataset includes outliers or noise. The density plots further highlight that confidence is most frequently observed in the 0.3–0.5 range, which could reflect a threshold for acceptable performance in the analyzed context.