## Line Chart: Accuracy vs. Compute (exaFLOP)
### Overview
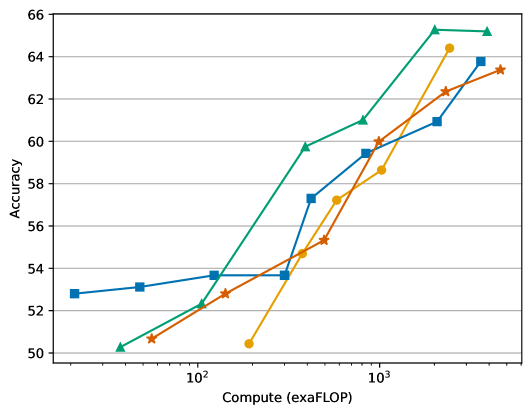
The chart illustrates the relationship between computational resources (measured in exaFLOP) and model accuracy across four distinct data series. Each series is represented by a unique color and marker type, with accuracy plotted on the y-axis (50–66) and compute on the x-axis (10²–10³).
### Components/Axes
- **X-axis (Compute)**: Labeled "Compute (exaFLOP)" with logarithmic scale markers at 10² (100), 10³ (1000).
- **Y-axis (Accuracy)**: Labeled "Accuracy" with linear scale markers from 50 to 66.
- **Legend**: Positioned on the right, associating colors and markers:
- Green triangles (Line A)
- Orange stars (Line B)
- Blue squares (Line C)
- Yellow diamonds (Line D)
### Detailed Analysis
#### Line A (Green Triangles)
- **Trend**: Starts at ~50.1 (10²) and rises sharply to ~65.0 (10³).
- **Key Points**:
- 10²: ~50.1
- 10³: ~65.0
#### Line B (Orange Stars)
- **Trend**: Gradual upward slope from ~50.5 (10²) to ~64.3 (10³).
- **Key Points**:
- 10²: ~50.5
- 10³: ~64.3
#### Line C (Blue Squares)
- **Trend**: Steeper increase after 10², reaching ~63.8 (10³).
- **Key Points**:
- 10²: ~52.8
- 10³: ~63.8
#### Line D (Yellow Diamonds)
- **Trend**: Sharp rise from ~50.3 (10²) to ~64.5 (10³).
- **Key Points**:
- 10²: ~50.3
- 10³: ~64.5
### Key Observations
1. **Line A (Green)** exhibits the steepest initial increase, suggesting rapid accuracy gains with compute.
2. **Line D (Yellow)** starts lowest but surpasses others by 10³, indicating strong scalability.
3. **Line B (Orange)** and **Line C (Blue)** show more gradual improvements, with Line C outperforming Line B at higher compute levels.
4. All lines converge near 64–65 accuracy at 10³ exaFLOP, suggesting diminishing returns at extreme compute levels.
### Interpretation
The data demonstrates a clear positive correlation between compute resources and model accuracy. Line A’s sharp rise implies it may leverage more efficient algorithms or architectures, while Line D’s late surge highlights potential for underperforming models to catch up with sufficient resources. The convergence at high compute levels suggests that beyond a certain threshold, additional compute yields minimal accuracy improvements. This could inform resource allocation strategies for model training, prioritizing models with higher scalability (e.g., Line A or D) for optimal performance.
**Note**: Values are approximate, with uncertainty due to visual estimation from the chart. No textual content or non-English elements are present.