## Pie Charts: Synthetic Problems Difficulty for Different Models
### Overview
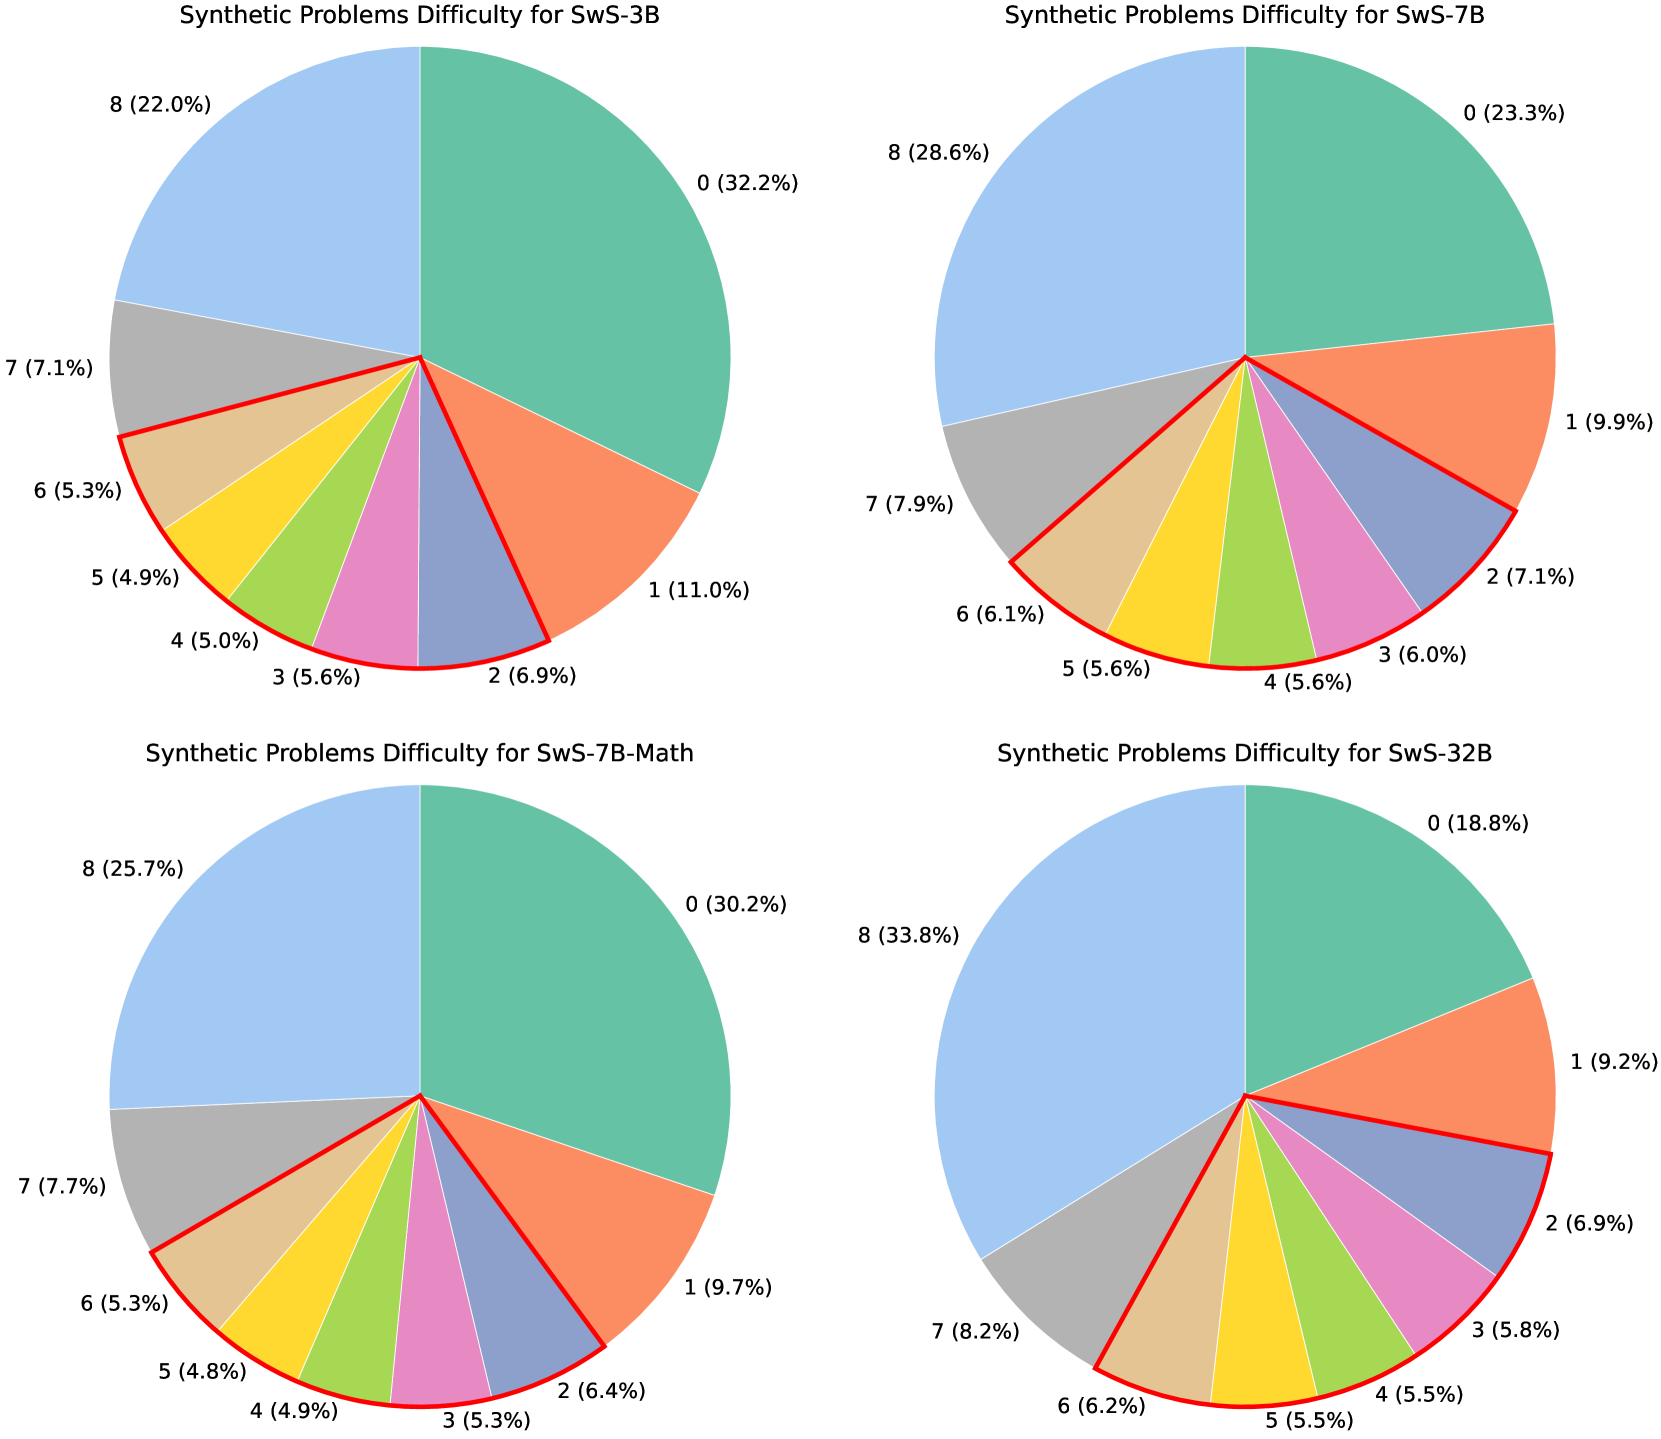
The image contains four pie charts, each representing the distribution of difficulty levels for synthetic problems encountered by different models: SwS-3B, SwS-7B, SwS-7B-Math, and SwS-32B. The difficulty levels range from 0 to 8, and each slice of the pie chart indicates the percentage of problems falling into that difficulty category. A red line highlights the slices representing difficulty levels 2 through 7.
### Components/Axes
Each pie chart has the following components:
* **Title:** Specifies the model for which the difficulty distribution is shown (e.g., "Synthetic Problems Difficulty for SwS-3B").
* **Slices:** Each slice represents a difficulty level (0-8).
* **Labels:** Each slice is labeled with the difficulty level (0-8) and the corresponding percentage of problems at that difficulty.
* **Colors:** Each difficulty level is represented by a distinct color. The colors appear consistent across all four charts.
### Detailed Analysis
**Chart 1: Synthetic Problems Difficulty for SwS-3B**
* Difficulty 0 (Teal): 32.2%
* Difficulty 1 (Coral): 11.0%
* Difficulty 2 (Light Purple): 6.9%
* Difficulty 3 (Pink): 5.6%
* Difficulty 4 (Light Green): 5.0%
* Difficulty 5 (Yellow): 4.9%
* Difficulty 6 (Tan): 5.3%
* Difficulty 7 (Gray): 7.1%
* Difficulty 8 (Light Blue): 22.0%
**Chart 2: Synthetic Problems Difficulty for SwS-7B**
* Difficulty 0 (Teal): 23.3%
* Difficulty 1 (Coral): 9.9%
* Difficulty 2 (Light Purple): 7.1%
* Difficulty 3 (Pink): 6.0%
* Difficulty 4 (Light Green): 5.6%
* Difficulty 5 (Yellow): 5.6%
* Difficulty 6 (Tan): 6.1%
* Difficulty 7 (Gray): 7.9%
* Difficulty 8 (Light Blue): 28.6%
**Chart 3: Synthetic Problems Difficulty for SwS-7B-Math**
* Difficulty 0 (Teal): 30.2%
* Difficulty 1 (Coral): 9.7%
* Difficulty 2 (Light Purple): 6.4%
* Difficulty 3 (Pink): 5.3%
* Difficulty 4 (Light Green): 4.9%
* Difficulty 5 (Yellow): 4.8%
* Difficulty 6 (Tan): 5.3%
* Difficulty 7 (Gray): 7.7%
* Difficulty 8 (Light Blue): 25.7%
**Chart 4: Synthetic Problems Difficulty for SwS-32B**
* Difficulty 0 (Teal): 18.8%
* Difficulty 1 (Coral): 9.2%
* Difficulty 2 (Light Purple): 6.9%
* Difficulty 3 (Pink): 5.8%
* Difficulty 4 (Light Green): 5.5%
* Difficulty 5 (Yellow): 5.5%
* Difficulty 6 (Tan): 6.2%
* Difficulty 7 (Gray): 8.2%
* Difficulty 8 (Light Blue): 33.8%
### Key Observations
* Difficulty levels 0 and 8 consistently represent the largest percentages across all models.
* The distribution of difficulty levels 2 through 7 is relatively similar across all models, with each level accounting for a small percentage of the total.
* SwS-32B has the highest percentage of problems at difficulty level 8 (33.8%) and the lowest percentage at difficulty level 0 (18.8%) compared to the other models.
### Interpretation
The pie charts provide a visual representation of the difficulty distribution of synthetic problems for different models. The data suggests that the models encounter a significant portion of problems at the easiest (0) and hardest (8) difficulty levels. The red line highlights the distribution of the mid-range difficulty levels (2-7), which appear to be relatively consistent across all models. The SwS-32B model seems to encounter a higher proportion of the most difficult problems compared to the other models, potentially indicating a different learning or problem-solving approach. The data could be used to compare the performance and learning characteristics of the different models on synthetic problems.