## Pie Charts: Synthetic Problems Difficulty for SwS-3B, SwS-7B, SwS-7B-Math, SwS-32B
### Overview
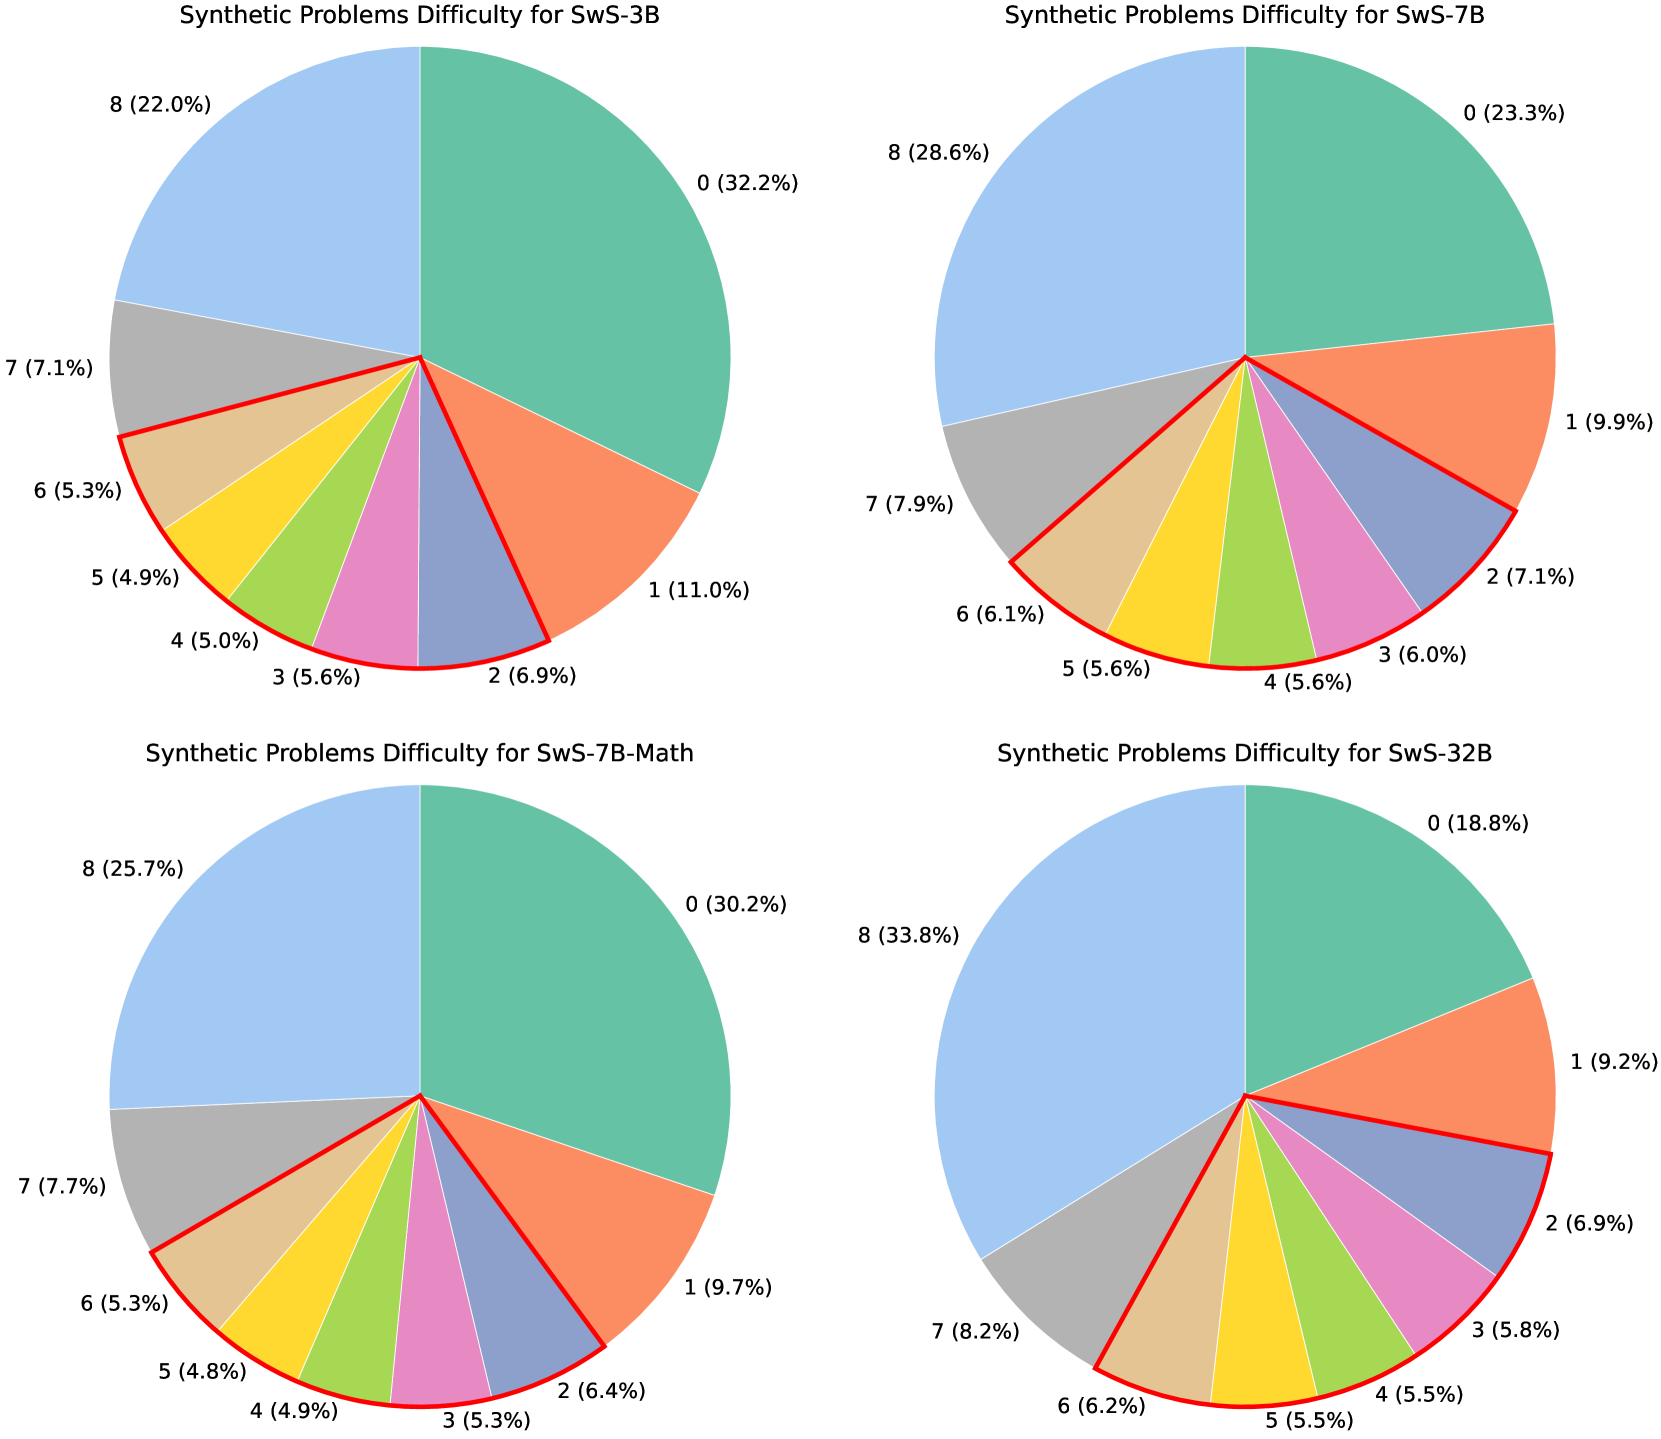
The image contains four pie charts comparing the distribution of synthetic problem difficulty levels (0–8) across four SwS versions: SwS-3B, SwS-7B, SwS-7B-Math, and SwS-32B. Each chart uses distinct colors for difficulty levels, with percentages labeled for each segment.
### Components/Axes
- **Legend**: Integrated into each chart, with colors mapped to difficulty levels (0–8). Colors are consistent across charts for the same difficulty level (e.g., teal for 0, blue for 8).
- **Labels**: Difficulty levels (0–8) and percentages are placed clockwise around each pie chart.
- **Colors**:
- 0: Teal (#008080)
- 1: Red (#FF0000)
- 2: Light Blue (#ADD8E6)
- 3: Pink (#FFC0CB)
- 4: Green (#00FF00)
- 5: Yellow (#FFFF00)
- 6: Orange (#FFA500)
- 7: Gray (#808080)
- 8: Light Blue (#ADD8E6)
### Detailed Analysis
#### SwS-3B
- **0 (32.2%)**: Largest segment (teal).
- **8 (22.0%)**: Second-largest (light blue).
- **1 (11.0%)**: Third-largest (red).
- Remaining segments (2–7) range from 2.9% to 7.1%.
#### SwS-7B
- **0 (23.3%)**: Largest segment (teal).
- **8 (28.6%)**: Second-largest (light blue).
- **1 (9.9%)**: Third-largest (red).
- Remaining segments (2–7) range from 5.0% to 7.9%.
#### SwS-7B-Math
- **0 (30.2%)**: Largest segment (teal).
- **8 (25.7%)**: Second-largest (light blue).
- **1 (9.7%)**: Third-largest (red).
- Remaining segments (2–7) range from 4.8% to 7.7%.
#### SwS-32B
- **8 (33.8%)**: Largest segment (light blue).
- **0 (18.8%)**: Second-largest (teal).
- **1 (9.2%)**: Third-largest (red).
- Remaining segments (2–7) range from 5.5% to 8.2%.
### Key Observations
1. **Difficulty 0 Dominance**: SwS-3B and SwS-7B-Math have the highest percentages for difficulty 0 (32.2% and 30.2%, respectively), while SwS-32B has the lowest (18.8%).
2. **Difficulty 8 Trends**: SwS-32B has the highest difficulty 8 percentage (33.8%), significantly higher than SwS-7B (28.6%) and SwS-7B-Math (25.7%).
3. **Middle Difficulties**: SwS-7B and SwS-32B show more balanced distributions for difficulties 4–6 compared to SwS-3B and SwS-7B-Math.
4. **Consistency in Color Mapping**: All charts use identical color coding for the same difficulty levels, ensuring cross-chart comparability.
### Interpretation
The data suggests that SwS-32B excels at handling harder problems (difficulty 8), while SwS-3B and SwS-7B-Math are more effective at easier problems (difficulty 0). The middle difficulty levels (4–6) show less variation across models, indicating similar performance in average-difficulty problem-solving. The stark contrast in difficulty 8 performance between SwS-32B and other models highlights potential architectural or training differences optimized for complex tasks. The consistent color mapping across charts enables straightforward visual comparison of difficulty distributions.