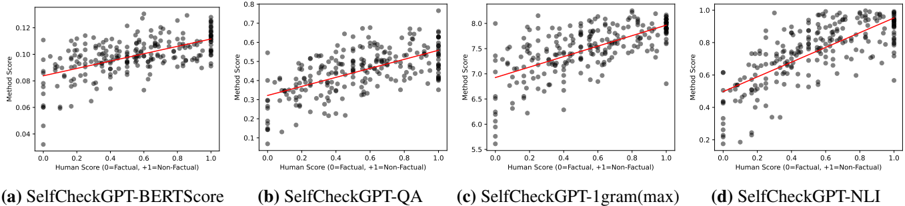
## Scatter Plot Matrix: SelfCheckGPT Performance vs. Human Score
### Overview
The image presents a matrix of four scatter plots, each evaluating the performance of a different variant of the SelfCheckGPT method against human scores. The x-axis represents the human score, where 0 indicates "Factual" and +1 indicates "Non-Factual". The y-axis represents the method score. Each plot includes a red line of best fit, visually indicating the correlation between the method's score and the human score.
### Components/Axes
* **X-axis (Horizontal):** "Human Score (0=Factual, +1=Non-Factual)". Scale ranges from 0.0 to 1.0.
* **Y-axis (Vertical):** "Method Score". The scale varies between plots.
* Plot (a): 0.04 to 0.12
* Plot (b): 0.1 to 0.8
* Plot (c): 5.5 to 8.0
* Plot (d): 0.0 to 1.0
* **Data Points:** Grey circles representing individual data points.
* **Line of Best Fit:** Red line indicating the general trend of the data.
* **Plot Titles:**
* (a) SelfCheckGPT-BERTScore
* (b) SelfCheckGPT-QA
* (c) SelfCheckGPT-1gram(max)
* (d) SelfCheckGPT-NLI
### Detailed Analysis
**Plot (a): SelfCheckGPT-BERTScore**
* **Y-axis:** Method Score ranges from approximately 0.04 to 0.12.
* **Trend:** The red line of best fit shows a slight positive correlation.
* **Data Points:**
* At Human Score 0.0, Method Scores range from approximately 0.03 to 0.11.
* At Human Score 1.0, Method Scores range from approximately 0.08 to 0.12.
**Plot (b): SelfCheckGPT-QA**
* **Y-axis:** Method Score ranges from approximately 0.1 to 0.8.
* **Trend:** The red line of best fit shows a positive correlation.
* **Data Points:**
* At Human Score 0.0, Method Scores range from approximately 0.1 to 0.6.
* At Human Score 1.0, Method Scores range from approximately 0.5 to 0.8.
**Plot (c): SelfCheckGPT-1gram(max)**
* **Y-axis:** Method Score ranges from approximately 5.5 to 8.0.
* **Trend:** The red line of best fit shows a positive correlation.
* **Data Points:**
* At Human Score 0.0, Method Scores range from approximately 5.5 to 7.5.
* At Human Score 1.0, Method Scores range from approximately 7.0 to 8.0.
**Plot (d): SelfCheckGPT-NLI**
* **Y-axis:** Method Score ranges from approximately 0.0 to 1.0.
* **Trend:** The red line of best fit shows a positive correlation.
* **Data Points:**
* At Human Score 0.0, Method Scores range from approximately 0.1 to 0.8.
* At Human Score 1.0, Method Scores range from approximately 0.7 to 1.0.
### Key Observations
* All four SelfCheckGPT variants show a positive correlation between the human score (factual vs. non-factual) and the method score. This suggests that as the human score indicates non-factuality, the method score tends to increase.
* The range of method scores varies significantly between the different SelfCheckGPT variants.
* The spread of data points around the line of best fit varies between the plots, indicating differences in the consistency of the methods.
### Interpretation
The scatter plot matrix provides a comparative analysis of different SelfCheckGPT methods in relation to human assessment of factuality. The positive correlations observed in all plots suggest that these methods are generally capable of distinguishing between factual and non-factual content, aligning with human judgment to some extent. However, the varying ranges and spreads of data points indicate that the methods differ in their sensitivity, consistency, and overall performance. The SelfCheckGPT-NLI variant appears to have the widest range of scores, potentially indicating a greater ability to discriminate between factual and non-factual content, while the SelfCheckGPT-BERTScore variant has a much narrower range. The lines of best fit are useful for visualizing the general trend, but the scatter of points around these lines indicates that the relationship between human and method scores is not perfectly linear and that other factors may be influencing the results.