\n
## Line Chart: Two-Stage Code RL
### Overview
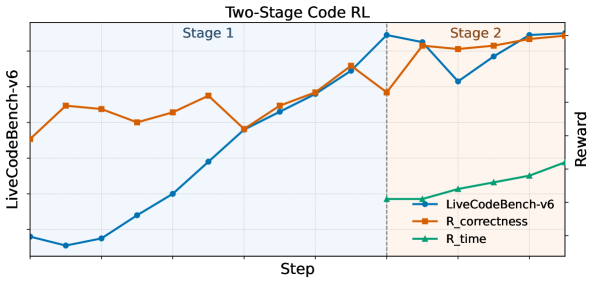
The image presents a line chart illustrating the performance of a two-stage reinforcement learning (RL) model on the LiveCodeBench-v6 environment. The chart tracks the reward received over steps, broken down into two stages. Three reward metrics are displayed: LiveCodeBench-v6, R_correctness, and R_time. The chart visually demonstrates how these metrics evolve across the two stages of the RL process.
### Components/Axes
* **Title:** "Two-Stage Code RL" (centered at the top)
* **X-axis:** "Step" (bottom) - The horizontal axis represents the step number in the reinforcement learning process. The scale is not explicitly labeled, but appears to range from approximately 0 to 25.
* **Y-axis (Left):** "LiveCodeBench-v6" (left) - This vertical axis corresponds to the LiveCodeBench-v6 reward metric. The scale is not explicitly labeled, but appears to range from approximately 0 to 1.2.
* **Y-axis (Right):** "Reward" (right) - This vertical axis corresponds to the R_correctness and R_time reward metrics. The scale is not explicitly labeled, but appears to range from approximately 0 to 1.
* **Stages:** The chart is divided into two stages, labeled "Stage 1" (left, blue background) and "Stage 2" (right, orange background). The division occurs at approximately step 14.
* **Legend:** Located in the bottom-right corner.
* Blue Line: "LiveCodeBench-v6"
* Orange Line: "R_correctness"
* Green Line: "R_time"
### Detailed Analysis
* **LiveCodeBench-v6 (Blue Line):** The line starts at approximately 0.1 at step 0, decreases to approximately 0.05 at step 2, then steadily increases to approximately 0.8 at step 14. In Stage 2, it fluctuates between approximately 0.6 and 0.9, ending at approximately 0.85 at step 25. The trend is generally upward, with some oscillation in Stage 2.
* **R_correctness (Orange Line):** The line begins at approximately 0.5 at step 0, fluctuates around 0.4-0.5 until step 8, then increases to approximately 0.6 at step 14. In Stage 2, it initially rises to approximately 0.7 at step 16, then declines to approximately 0.5 at step 20, and finally recovers to approximately 0.6 at step 25. The trend is relatively stable, with a slight overall increase.
* **R_time (Green Line):** The line starts at approximately 0.1 at step 0 and exhibits a consistent, gradual upward trend throughout both stages. It reaches approximately 0.3 at step 14 and continues to approximately 0.4 at step 25. The trend is consistently upward.
### Key Observations
* The most significant performance improvement occurs during Stage 1 for the LiveCodeBench-v6 metric.
* R_time consistently increases throughout the entire process, suggesting that the model is becoming more efficient over time.
* R_correctness shows some fluctuation in Stage 2, indicating potential instability or challenges in maintaining correctness as the model progresses.
* The division between Stage 1 and Stage 2 appears to coincide with a shift in the learning dynamics.
### Interpretation
The chart suggests that the two-stage RL approach is effective in improving the performance of the model on the LiveCodeBench-v6 environment. Stage 1 focuses on initial learning and rapid improvement in the overall reward (LiveCodeBench-v6). Stage 2 appears to refine the model, with a focus on maintaining correctness (R_correctness) and improving efficiency (R_time). The fluctuations in R_correctness during Stage 2 could indicate a trade-off between correctness and efficiency, or the need for further tuning of the RL algorithm. The consistent increase in R_time suggests that the model is learning to solve the coding tasks more quickly over time. The data suggests a successful implementation of a two-stage RL strategy, with each stage contributing to different aspects of the model's performance.