# Technical Document Analysis: Two-Stage Code RL Performance
## Chart Overview
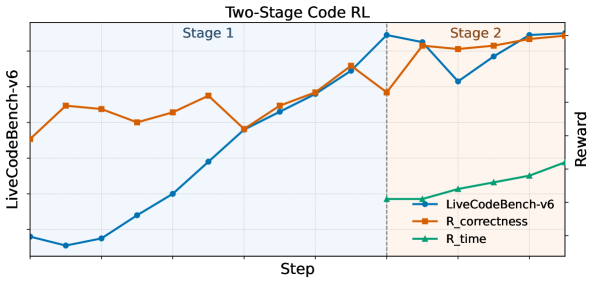
The image depicts a **line chart** titled **"Two-Stage Code RL"**, comparing performance metrics across two training stages. The chart uses three data series to visualize trends in code reasoning performance.
---
### **Key Components**
1. **Axes**
- **X-axis (Horizontal):** Labeled **"Step"** with markers from **0 to 10**.
- **Y-axis (Vertical):** Labeled **"LiveCodeBench-v6"** with markers from **0 to 6**.
2. **Legend**
- Located in the **bottom-right corner**.
- **Colors and Labels:**
- **Blue:** `LiveCodeBench-v6` (primary metric)
- **Orange:** `R_correctness` (reasoning correctness)
- **Green:** `R_time` (reasoning time efficiency)
3. **Stages**
- A **vertical dashed line** at **Step 5** divides the chart into:
- **Stage 1** (left of the line)
- **Stage 2** (right of the line)
---
### **Data Trends**
1. **LiveCodeBench-v6 (Blue Line)**
- **Stage 1 (Steps 0–5):**
- Starts at **~0.5** and increases steadily to **~3.5**.
- **Stage 2 (Steps 5–10):**
- Rises sharply to **~5.5** by Step 10.
- **Trend:** Consistent upward trajectory.
2. **R_correctness (Orange Line)**
- **Stage 1 (Steps 0–5):**
- Fluctuates between **~2.0** and **~3.0**.
- **Stage 2 (Steps 5–10):**
- Stabilizes around **~4.0–5.0** with minor oscillations.
- **Trend:** Gradual improvement with reduced volatility in Stage 2.
3. **R_time (Green Line)**
- **Stage 1 (Steps 0–5):**
- Remains flat at **~0.5**.
- **Stage 2 (Steps 5–10):**
- Increases linearly to **~2.0** by Step 10.
- **Trend:** Sharp rise in Stage 2.
---
### **Spatial Grounding**
- **Legend Position:** Bottom-right corner (confirmed via visual alignment).
- **Color Consistency:**
- Blue line matches `LiveCodeBench-v6`.
- Orange line matches `R_correctness`.
- Green line matches `R_time`.
---
### **Textual Elements**
- **Title:** "Two-Stage Code RL" (centered at the top).
- **Stage Labels:**
- "Stage 1" (above the dashed line).
- "Stage 2" (to the right of the dashed line).
- **Legend Text:**
- `LiveCodeBench-v6` (blue)
- `R_correctness` (orange)
- `R_time` (green)
---
### **Critical Observations**
1. **Stage 1 vs. Stage 2:**
- **LiveCodeBench-v6** shows the most significant improvement in Stage 2.
- **R_time** remains stable in Stage 1 but increases sharply in Stage 2, suggesting computational trade-offs.
- **R_correctness** stabilizes in Stage 2, indicating refined reasoning after initial fluctuations.
2. **Performance Correlation:**
- The rise in `LiveCodeBench-v6` aligns with improvements in `R_correctness` and increases in `R_time`, suggesting a trade-off between accuracy and efficiency.
---
### **Conclusion**
The chart illustrates the evolution of code reasoning performance across two training stages. While `LiveCodeBench-v6` and `R_correctness` improve steadily, `R_time` highlights a critical efficiency challenge in Stage 2. This data underscores the need for optimization strategies to balance accuracy and computational cost.