## Line Chart: MER Average vs N
### Overview
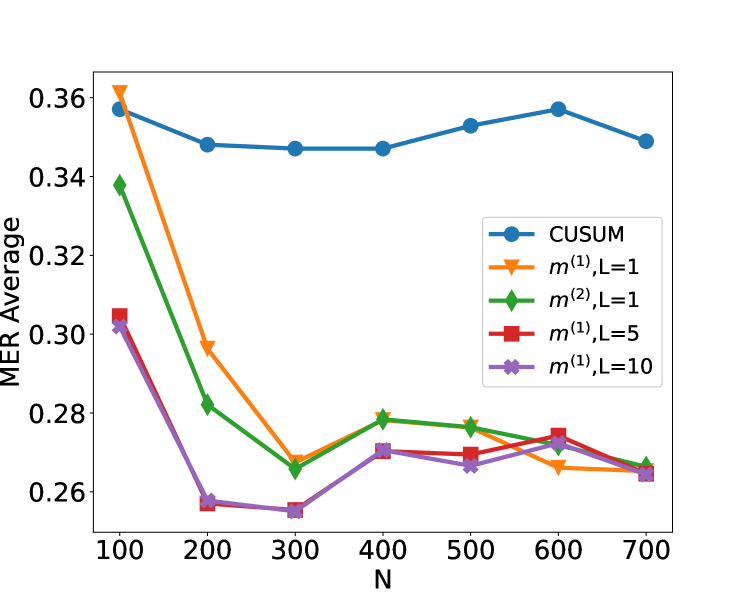
The image is a line chart comparing the MER (Minimum Error Rate) Average for different methods against the parameter 'N'. The chart displays five different data series: CUSUM, m^(1), L=1, m^(2), L=1, m^(1), L=5, and m^(1), L=10. The x-axis represents 'N', and the y-axis represents 'MER Average'.
### Components/Axes
* **X-axis:** Labeled "N", with tick marks at 100, 200, 300, 400, 500, 600, and 700.
* **Y-axis:** Labeled "MER Average", with tick marks at 0.26, 0.28, 0.30, 0.32, 0.34, and 0.36.
* **Legend:** Located in the top-right of the chart, it identifies each line by color and label:
* Blue: CUSUM
* Orange: m^(1), L=1
* Green: m^(2), L=1
* Red: m^(1), L=5
* Purple: m^(1), L=10
### Detailed Analysis
* **CUSUM (Blue):** The line starts at approximately 0.358 at N=100, decreases to around 0.347 at N=300, increases slightly to approximately 0.355 at N=600, and then decreases to around 0.350 at N=700.
* **m^(1), L=1 (Orange):** The line starts at approximately 0.362 at N=100, decreases sharply to around 0.297 at N=200, then decreases further to approximately 0.266 at N=300, and remains relatively flat around 0.270 until N=700.
* **m^(2), L=1 (Green):** The line starts at approximately 0.338 at N=100, decreases to around 0.281 at N=200, then decreases further to approximately 0.266 at N=300, increases slightly to approximately 0.278 at N=400, and remains relatively flat around 0.275 until N=700.
* **m^(1), L=5 (Red):** The line starts at approximately 0.304 at N=100, decreases to around 0.257 at N=200, then remains relatively flat around 0.270 until N=700.
* **m^(1), L=10 (Purple):** The line starts at approximately 0.302 at N=100, decreases to around 0.256 at N=200, then remains relatively flat around 0.265 until N=700.
### Key Observations
* The CUSUM method has the highest MER Average across all values of N.
* The m^(1), L=1 method starts with a high MER Average but decreases sharply as N increases.
* The m^(1), L=5 and m^(1), L=10 methods have the lowest MER Average for N greater than 200.
* All methods except CUSUM converge to a similar MER Average as N increases.
### Interpretation
The chart compares the performance of different methods for minimizing error rate as the parameter 'N' changes. The CUSUM method consistently performs worse than the other methods. The m^(1), L=5 and m^(1), L=10 methods appear to be the most effective at minimizing the error rate for larger values of N. The initial high error rate of m^(1), L=1 suggests that it may require a larger N to stabilize. The convergence of the methods at higher N values suggests that increasing N beyond a certain point may not significantly improve performance.