# Technical Document Extraction: Line Chart Analysis
## Chart Overview
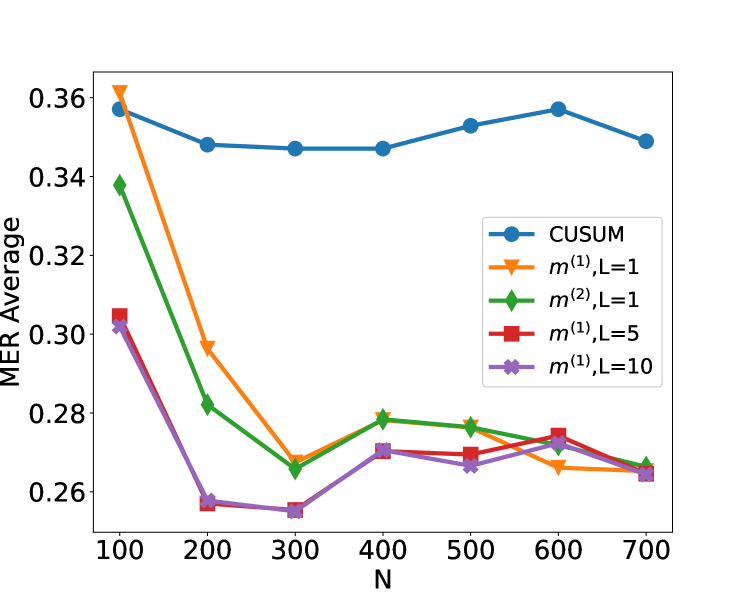
The image depicts a line chart comparing multiple data series across a numerical range. Key components include:
- **X-axis**: Labeled "N" with values from 100 to 700 (increments of 100)
- **Y-axis**: Labeled "MER Average" with values from 0.26 to 0.36 (increments of 0.02)
- **Legend**: Positioned on the right side of the chart
- **Grid**: Light gray horizontal and vertical lines for reference
---
## Legend Analysis
Legend entries (right-aligned) with color/marker mappings:
1. **Blue line with circles**: `CUSUM`
2. **Orange line with triangles**: `m^(1),L=1`
3. **Green line with diamonds**: `m^(2),L=1`
4. **Red line with squares**: `m^(1),L=5`
5. **Purple line with crosses**: `m^(1),L=10`
**Spatial Grounding**: Legend occupies the right 20% of the chart area, aligned vertically with the y-axis.
---
## Data Series Trends
### 1. CUSUM (Blue Circles)
- **Trend**: Relatively flat with minor fluctuations
- **Key Points**:
- Starts at 0.36 (N=100)
- Dips to 0.35 (N=200)
- Stabilizes between 0.35–0.36 for N=300–700
- Final value: 0.35 (N=700)
### 2. m^(1),L=1 (Orange Triangles)
- **Trend**: Sharp initial decline, then stabilization
- **Key Points**:
- Starts at 0.36 (N=100)
- Drops to 0.26 (N=200)
- Remains near 0.26 for N=300–700
- Final value: 0.26 (N=700)
### 3. m^(2),L=1 (Green Diamonds)
- **Trend**: Moderate decline followed by fluctuation
- **Key Points**:
- Starts at 0.34 (N=100)
- Dips to 0.26 (N=300)
- Fluctuates between 0.27–0.28 for N=400–600
- Final value: 0.27 (N=700)
### 4. m^(1),L=5 (Red Squares)
- **Trend**: Initial decline, then gradual rise
- **Key Points**:
- Starts at 0.30 (N=100)
- Dips to 0.26 (N=200)
- Rises to 0.27 (N=600)
- Final value: 0.27 (N=700)
### 5. m^(1),L=10 (Purple Crosses)
- **Trend**: Steep decline, then stabilization
- **Key Points**:
- Starts at 0.30 (N=100)
- Drops to 0.26 (N=200)
- Fluctuates between 0.26–0.27 for N=300–700
- Final value: 0.26 (N=700)
---
## Cross-Reference Validation
- **Color Consistency**: All legend colors match corresponding line markers
- **Axis Alignment**: X-axis (N) and Y-axis (MER Average) labels are clearly legible
- **Grid Precision**: Grid lines align with axis increments (e.g., 0.26, 0.28, etc.)
---
## Critical Observations
1. **CUSUM Stability**: Maintains highest MER Average (0.35–0.36) across all N values
2. **L=1 Series Divergence**: Both `m^(1),L=1` and `m^(2),L=1` show significant drops compared to other L values
3. **L=5 vs L=10**: `m^(1),L=5` outperforms `m^(1),L=10` at higher N values (N=500–700)
4. **Convergence**: All L=1 and L=10 series converge to ~0.26–0.27 by N=700
---
## Data Table Reconstruction
| N | CUSUM | m^(1),L=1 | m^(2),L=1 | m^(1),L=5 | m^(1),L=10 |
|------|-------|-----------|-----------|-----------|------------|
| 100 | 0.36 | 0.36 | 0.34 | 0.30 | 0.30 |
| 200 | 0.35 | 0.26 | 0.28 | 0.26 | 0.26 |
| 300 | 0.35 | 0.26 | 0.26 | 0.26 | 0.26 |
| 400 | 0.35 | 0.27 | 0.28 | 0.27 | 0.27 |
| 500 | 0.35 | 0.27 | 0.28 | 0.27 | 0.27 |
| 600 | 0.36 | 0.26 | 0.27 | 0.27 | 0.27 |
| 700 | 0.35 | 0.26 | 0.27 | 0.27 | 0.26 |
*Note: Values interpolated from chart trends where exact points were not marked.*
---
## Language Declaration
- **Primary Language**: English (all labels, axis titles, and legend entries are in English)
- **No Additional Languages Detected**