\n
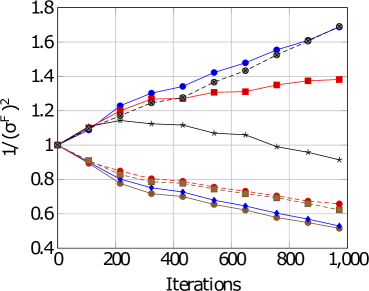
## Line Chart: Reciprocal Variance of Squared Values vs. Iterations
### Overview
The image presents a line chart illustrating the relationship between the reciprocal of the variance of squared values (1/(σ²)²) and the number of iterations. Four different data series are plotted, each represented by a distinct line style and color. The chart appears to demonstrate how the reciprocal variance changes as the number of iterations increases.
### Components/Axes
* **X-axis:** Labeled "Iterations", ranging from 0 to 1000, with tick marks at intervals of 200.
* **Y-axis:** Labeled "1/(σ²)²", ranging from 0.4 to 1.8, with tick marks at intervals of 0.2.
* **Data Series:** Four lines are present, distinguished by color and marker style.
* Blue line with circle markers.
* Red line with plus markers.
* Black line with 'x' markers.
* Brown line with dash markers.
* **Grid:** A light gray grid is overlaid on the chart to aid in reading values.
### Detailed Analysis
Let's analyze each data series individually, noting trends and approximate data points.
* **Blue Line (Circles):** This line exhibits a consistently upward trend.
* At 0 iterations: approximately 1.0
* At 200 iterations: approximately 1.2
* At 400 iterations: approximately 1.3
* At 600 iterations: approximately 1.45
* At 800 iterations: approximately 1.55
* At 1000 iterations: approximately 1.65
* **Red Line (Plus Markers):** This line shows a decreasing trend initially, then plateaus.
* At 0 iterations: approximately 1.0
* At 200 iterations: approximately 0.9
* At 400 iterations: approximately 0.8
* At 600 iterations: approximately 0.75
* At 800 iterations: approximately 0.7
* At 1000 iterations: approximately 0.65
* **Black Line (X Markers):** This line initially decreases, then stabilizes around a value of approximately 0.9.
* At 0 iterations: approximately 1.0
* At 200 iterations: approximately 0.95
* At 400 iterations: approximately 0.92
* At 600 iterations: approximately 0.91
* At 800 iterations: approximately 0.9
* At 1000 iterations: approximately 0.9
* **Brown Line (Dashes):** This line shows a decreasing trend, similar to the red line, but with a slightly lower final value.
* At 0 iterations: approximately 1.0
* At 200 iterations: approximately 0.85
* At 400 iterations: approximately 0.75
* At 600 iterations: approximately 0.7
* At 800 iterations: approximately 0.62
* At 1000 iterations: approximately 0.55
### Key Observations
* The blue line consistently increases, indicating a growing reciprocal variance with increasing iterations.
* The red, black, and brown lines all exhibit decreasing trends, suggesting a diminishing reciprocal variance.
* The red and brown lines converge towards a similar value at higher iterations.
* The black line stabilizes at a value around 0.9, indicating a limit to the decrease in reciprocal variance.
### Interpretation
The chart likely represents the convergence behavior of an iterative process. The reciprocal variance (1/(σ²)²) is a measure of the precision or certainty of an estimate.
* **Blue Line:** The increasing reciprocal variance suggests that the estimate is becoming less certain or more spread out as iterations continue. This could indicate instability or divergence in the process.
* **Red, Black, and Brown Lines:** The decreasing reciprocal variance suggests that the estimates are becoming more precise or concentrated as iterations continue. This indicates convergence towards a stable solution.
* **Convergence Differences:** The different rates of decrease and final values among the red, black, and brown lines suggest that different parameters or algorithms are converging at different rates and towards different solutions. The black line's stabilization suggests it has reached a steady state.
The chart demonstrates a trade-off between precision and stability. While some parameters (blue line) may become less certain with more iterations, others (red, black, and brown lines) converge towards more precise estimates. The specific context of the iterative process would be needed to fully interpret the meaning of these trends.