TECHNICAL ASSET FINGERPRINT
5ca759a5dd282dadc5342fa9
Click to view fullscreen
Press ESC or click to close
FOUND IN PAPERS
EXPERT: healer-alpha-free VERSION 1
RUNTIME: free/openrouter/healer-alpha
INTEL_VERIFIED
## Line Charts: Comparative Performance of World Modeling Approaches
### Overview
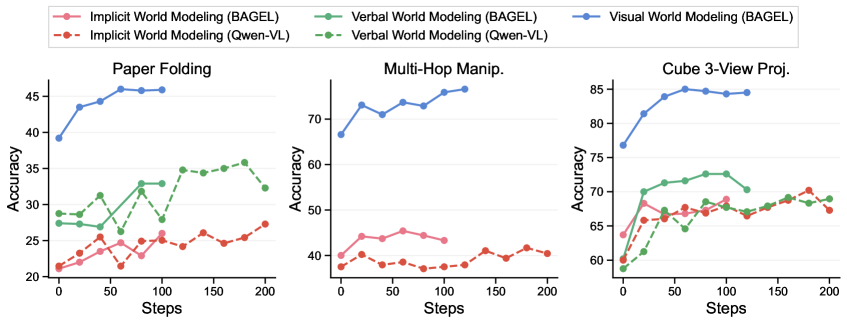
The image displays three horizontally arranged line charts comparing the accuracy of six different world modeling approaches across three distinct tasks over 200 training steps. The approaches are variants of two models, "BAGEL" and "Qwen-VL," each employing "Implicit," "Verbal," or "Visual" world modeling techniques. The charts collectively demonstrate the learning curves and relative performance of these methods.
### Components/Axes
* **Legend:** Positioned at the top center of the entire figure. It contains six entries, each with a unique color and line/marker style:
* **Pink solid line with circle markers:** Implicit World Modeling (BAGEL)
* **Green solid line with circle markers:** Verbal World Modeling (BAGEL)
* **Blue solid line with circle markers:** Visual World Modeling (BAGEL)
* **Red dashed line with circle markers:** Implicit World Modeling (Qwen-VL)
* **Green dashed line with circle markers:** Verbal World Modeling (Qwen-VL)
* **Blue dashed line with circle markers:** Visual World Modeling (Qwen-VL)
* **Common Axes:**
* **X-axis (All Charts):** Label: "Steps". Scale: 0 to 200, with major ticks at 0, 50, 100, 150, 200.
* **Y-axis (All Charts):** Label: "Accuracy". Scale varies per chart.
* **Chart Titles (Left to Right):**
1. "Paper Folding"
2. "Multi-Hop Manip."
3. "Cube 3-View Proj."
### Detailed Analysis
#### Chart 1: Paper Folding
* **Y-axis Range:** 20 to 45.
* **Data Series & Approximate Trends/Points:**
* **Visual World Modeling (BAGEL) [Blue Solid]:** Shows a strong, consistent upward trend. Starts at ~39 (Step 0), rises sharply to ~44 (Step 25), then gradually increases to plateau at ~46 (Steps 100-200). This is the top-performing series.
* **Verbal World Modeling (BAGEL) [Green Solid]:** Volatile upward trend. Starts at ~28 (Step 0), fluctuates between ~27-33, and ends at ~33 (Step 200).
* **Implicit World Modeling (BAGEL) [Pink Solid]:** Slow, steady upward trend. Starts at ~21 (Step 0), rises gradually to ~27 (Step 200).
* **Verbal World Modeling (Qwen-VL) [Green Dashed]:** Highly volatile. Starts at ~28 (Step 0), spikes to ~31 (Step 25), drops to ~27 (Step 75), peaks at ~36 (Step 175), and ends at ~32 (Step 200).
* **Implicit World Modeling (Qwen-VL) [Red Dashed]:** Volatile with a slight upward trend. Starts at ~21 (Step 0), fluctuates between ~21-26, and ends at ~27 (Step 200).
* **Visual World Modeling (Qwen-VL) [Blue Dashed]:** *Not visibly present in this chart.* The legend entry exists, but no corresponding blue dashed line is plotted.
#### Chart 2: Multi-Hop Manip.
* **Y-axis Range:** 40 to 70.
* **Data Series & Approximate Trends/Points:**
* **Visual World Modeling (BAGEL) [Blue Solid]:** Dominant performance with a clear upward trend. Starts at ~67 (Step 0), jumps to ~73 (Step 25), and continues to rise to ~75 (Step 125). The line ends at Step 125.
* **Implicit World Modeling (BAGEL) [Pink Solid]:** Relatively flat, low performance. Hovers between ~43-45 from Step 0 to Step 100, then ends at ~44 (Step 100).
* **Implicit World Modeling (Qwen-VL) [Red Dashed]:** Low and volatile. Starts at ~38 (Step 0), fluctuates between ~37-42, and ends at ~40 (Step 200).
* **Verbal World Modeling (BAGEL) [Green Solid] & Verbal World Modeling (Qwen-VL) [Green Dashed]:** *Not visibly present in this chart.* The legend entries exist, but no corresponding green lines are plotted.
* **Visual World Modeling (Qwen-VL) [Blue Dashed]:** *Not visibly present in this chart.*
#### Chart 3: Cube 3-View Proj.
* **Y-axis Range:** 60 to 85.
* **Data Series & Approximate Trends/Points:**
* **Visual World Modeling (BAGEL) [Blue Solid]:** Starts highest and plateaus. Begins at ~77 (Step 0), rises to ~85 (Step 50), and remains stable at ~85 through Step 125.
* **Verbal World Modeling (BAGEL) [Green Solid]:** Steady upward trend. Starts at ~59 (Step 0), rises to ~73 (Step 75), and ends at ~70 (Step 125).
* **Implicit World Modeling (BAGEL) [Pink Solid]:** Upward trend with convergence. Starts at ~63 (Step 0), rises to ~69 (Step 75), and ends at ~68 (Step 125).
* **Verbal World Modeling (Qwen-VL) [Green Dashed]:** Volatile upward trend. Starts at ~59 (Step 0), fluctuates, peaks at ~70 (Step 175), and ends at ~69 (Step 200).
* **Implicit World Modeling (Qwen-VL) [Red Dashed]:** Volatile upward trend. Starts at ~61 (Step 0), fluctuates, peaks at ~70 (Step 175), and ends at ~67 (Step 200).
* **Visual World Modeling (Qwen-VL) [Blue Dashed]:** *Not visibly present in this chart.*
### Key Observations
1. **Consistent Dominance:** The "Visual World Modeling (BAGEL)" approach (blue solid line) is the top performer in all three tasks where it is plotted, showing strong and rapid learning.
2. **Task-Specific Presence:** The "Visual World Modeling (Qwen-VL)" (blue dashed line) and "Verbal World Modeling" approaches for both models are not plotted in all charts, suggesting they may not have been evaluated or performed too poorly to display on these scales for certain tasks.
3. **Performance Hierarchy:** A clear hierarchy is visible: Visual (BAGEL) > Verbal/Implicit (BAGEL) ≈ Verbal/Implicit (Qwen-VL). The BAGEL model variants generally outperform their Qwen-VL counterparts of the same modeling type.
4. **Convergence in Complex Task:** In the "Cube 3-View Proj." chart, the performance gap between the different non-visual methods narrows significantly by Step 200, all clustering around 67-70% accuracy, while the visual method maintains a lead at ~85%.
5. **Volatility:** The Qwen-VL variants (dashed lines) exhibit more volatility in their learning curves compared to the smoother BAGEL variants (solid lines).
### Interpretation
The data suggests a significant advantage for **visual world modeling** when implemented within the BAGEL architecture, particularly for spatial and manipulation tasks like paper folding and multi-hop manipulation. This method learns faster and achieves higher final accuracy. The **verbal and implicit modeling** approaches show comparable but lower performance, with higher volatility in the Qwen-VL model, indicating less stable learning. The absence of certain lines (e.g., Visual Qwen-VL) implies either a limitation in the experimental setup or a failure of that specific method-task combination to yield reportable results. The convergence of non-visual methods in the cube projection task suggests that for some problems, the choice between verbal and implicit modeling may be less critical than the decision to use a visual approach. Overall, the charts argue for the efficacy of visual representation learning in complex, physically-grounded reasoning tasks.
DECODING INTELLIGENCE...