## Contour Plot: R-squared Relationship
### Overview
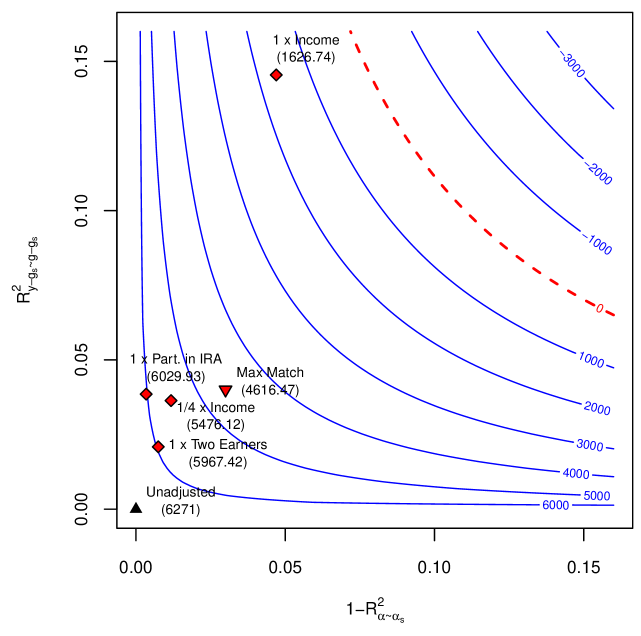
The image is a contour plot showing the relationship between two R-squared values: R²y-gs-g-gs on the y-axis and 1-R²α-αs on the x-axis. The plot includes blue contour lines representing different values, a red dashed line, and several data points marked with symbols and labels.
### Components/Axes
* **X-axis:** 1-R²α-αs, ranging from 0.00 to 0.15 in increments of 0.05.
* **Y-axis:** R²y-gs-g-gs, ranging from 0.00 to 0.15 in increments of 0.05.
* **Contour Lines:** Blue lines representing constant values, labeled with values from -3000 to 6000.
* **Red Dashed Line:** A dashed red line that separates regions of the plot.
* **Data Points:** Several data points are plotted, each labeled with a description and a numerical value in parentheses.
### Detailed Analysis
**Data Points:**
* **Unadjusted:** Located at approximately (0.00, 0.00), marked with a black triangle, value (6271).
* **1 x Two Earners:** Located at approximately (0.00, 0.02), marked with a red diamond, value (5967.42).
* **1/4 x Income:** Located at approximately (0.01, 0.03), marked with a red diamond, value (5476.12).
* **1 x Part. in IRA:** Located at approximately (0.00, 0.05), marked with a red diamond, value (6029.93).
* **Max Match:** Located at approximately (0.04, 0.04), marked with a red inverted triangle, value (4616.47).
* **1 x Income:** Located at approximately (0.03, 0.15), marked with a red diamond, value (1626.74).
**Contour Lines:**
* The blue contour lines represent values ranging from -3000 to 6000. The lines are denser in the bottom-left corner, indicating a steeper gradient in that region.
* The contour lines generally curve upwards and to the right.
* Specific contour line values: -3000, -2000, -1000, -0, 1000, 2000, 3000, 4000, 5000, 6000.
**Red Dashed Line:**
* The red dashed line starts at approximately (0.08, 0.00) and curves upwards and to the right, separating the plot into two regions.
### Key Observations
* The "Unadjusted" data point is located at the origin (0,0).
* The "1 x Income" data point has the lowest value (1626.74) and is located in the upper-left region of the plot.
* The contour lines indicate a complex relationship between the two R-squared values.
### Interpretation
The contour plot visualizes the relationship between two R-squared values, likely representing the variance explained by different models or factors. The data points represent specific scenarios or conditions, with the numerical values in parentheses potentially indicating a metric associated with each scenario (e.g., cost, benefit, or a specific outcome).
The contour lines show how the value changes as the two R-squared values vary. The red dashed line might represent a threshold or boundary of interest.
The placement of the data points relative to the contour lines and the red dashed line provides insights into the performance or characteristics of each scenario. For example, the "1 x Income" scenario has a low value and is located in a region with lower contour values, suggesting it might be associated with less desirable outcomes compared to other scenarios.