## Line Chart: RMSE vs. n for Different Algorithms
### Overview
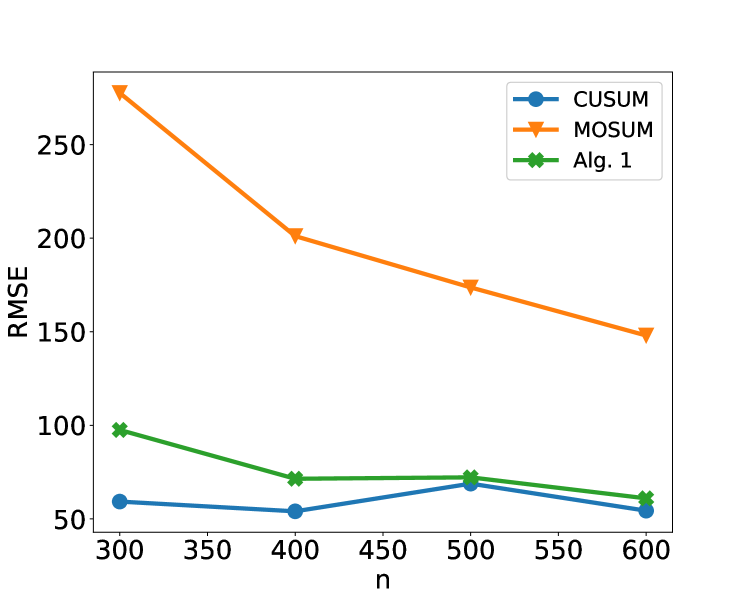
The image is a line chart comparing the Root Mean Squared Error (RMSE) of three algorithms (CUSUM, MOSUM, and Alg. 1) as a function of 'n'. The x-axis represents 'n', and the y-axis represents RMSE. The chart displays how the RMSE changes for each algorithm as 'n' increases.
### Components/Axes
* **Title:** Implicit, but the chart compares RMSE vs. n for different algorithms.
* **X-axis:**
* Label: "n"
* Scale: 300 to 600, with markers at 300, 350, 400, 450, 500, 550, and 600.
* **Y-axis:**
* Label: "RMSE"
* Scale: 50 to 250, with implicit markers at 50, 100, 150, 200, and 250.
* **Legend:** Located at the top-right of the chart.
* CUSUM (blue line with circle markers)
* MOSUM (orange line with triangle markers)
* Alg. 1 (green line with cross markers)
### Detailed Analysis
* **CUSUM (blue):** The line is relatively flat, indicating a stable RMSE across different values of 'n'.
* n = 300: RMSE ≈ 60
* n = 400: RMSE ≈ 55
* n = 500: RMSE ≈ 70
* n = 600: RMSE ≈ 60
* **MOSUM (orange):** The line slopes downward, indicating a decreasing RMSE as 'n' increases.
* n = 300: RMSE ≈ 275
* n = 400: RMSE ≈ 200
* n = 500: RMSE ≈ 175
* n = 600: RMSE ≈ 150
* **Alg. 1 (green):** The line slopes downward, indicating a decreasing RMSE as 'n' increases.
* n = 300: RMSE ≈ 98
* n = 400: RMSE ≈ 72
* n = 500: RMSE ≈ 72
* n = 600: RMSE ≈ 62
### Key Observations
* MOSUM has the highest RMSE values across the range of 'n' values.
* CUSUM has the lowest RMSE values and remains relatively stable.
* Alg. 1 starts with a higher RMSE than CUSUM but decreases to a similar level as 'n' increases.
* All algorithms show a general trend of decreasing or stable RMSE as 'n' increases, except for CUSUM which increases slightly between n=400 and n=500.
### Interpretation
The chart suggests that CUSUM is the most stable algorithm in terms of RMSE across the tested range of 'n' values. MOSUM has the highest error, while Alg. 1's performance improves as 'n' increases, eventually approaching the performance of CUSUM. The choice of algorithm would depend on the specific requirements of the application and the importance of minimizing RMSE for different values of 'n'. The data indicates that increasing 'n' generally leads to a reduction in RMSE for MOSUM and Alg. 1, but has little impact on CUSUM.