## Line Chart: RMSE vs. n for Different Algorithms
### Overview
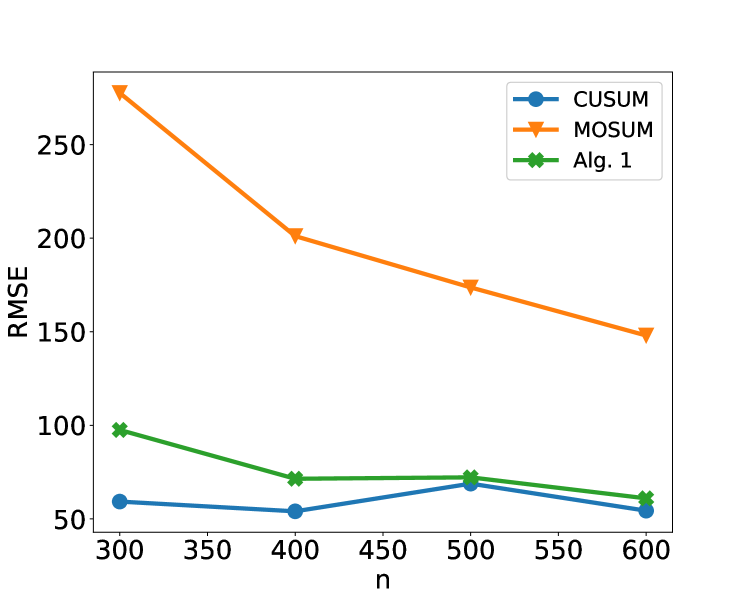
This image displays a line chart comparing the Root Mean Squared Error (RMSE) for three different algorithms (CUSUM, MOSUM, and Alg. 1) across varying values of 'n'. The x-axis represents 'n', and the y-axis represents RMSE.
### Components/Axes
* **X-axis Title**: 'n'
* **X-axis Markers**: 300, 350, 400, 450, 500, 550, 600
* **Y-axis Title**: 'RMSE'
* **Y-axis Markers**: 50, 100, 150, 200, 250
* **Legend**: Located in the top-right corner of the chart.
* **CUSUM**: Represented by blue circles (•).
* **MOSUM**: Represented by orange triangles (▼).
* **Alg. 1**: Represented by green crosses (x).
### Detailed Analysis or Content Details
**Data Series: CUSUM (Blue Circles)**
* **Trend**: The CUSUM line generally slopes upward slightly from n=300 to n=500, then dips slightly at n=600.
* **Data Points**:
* At n = 300, RMSE ≈ 58
* At n = 400, RMSE ≈ 53
* At n = 500, RMSE ≈ 67
* At n = 600, RMSE ≈ 57
**Data Series: MOSUM (Orange Triangles)**
* **Trend**: The MOSUM line shows a clear downward trend as 'n' increases.
* **Data Points**:
* At n = 300, RMSE ≈ 270
* At n = 400, RMSE ≈ 200
* At n = 500, RMSE ≈ 175
* At n = 600, RMSE ≈ 150
**Data Series: Alg. 1 (Green Crosses)**
* **Trend**: The Alg. 1 line shows a downward trend from n=300 to n=400, then plateaus or slightly decreases as 'n' increases further.
* **Data Points**:
* At n = 300, RMSE ≈ 98
* At n = 400, RMSE ≈ 70
* At n = 500, RMSE ≈ 70
* At n = 600, RMSE ≈ 58
### Key Observations
* The MOSUM algorithm consistently exhibits the highest RMSE across all tested values of 'n'.
* The CUSUM algorithm shows the lowest RMSE at n=400 and n=600, and is comparable to Alg. 1 at n=600.
* Alg. 1 demonstrates a significant reduction in RMSE from n=300 to n=400, after which its performance stabilizes.
* Both CUSUM and Alg. 1 show a convergence in RMSE values at n=600, with both being approximately 57-58.
### Interpretation
The chart suggests that for the given range of 'n', the MOSUM algorithm is the least effective in terms of minimizing RMSE, indicating higher error rates. Conversely, both CUSUM and Alg. 1 perform significantly better, especially at larger values of 'n'. The convergence of CUSUM and Alg. 1 at n=600 implies that for larger sample sizes, their performance in terms of RMSE becomes comparable. The initial sharp decrease in RMSE for Alg. 1 from n=300 to n=400 might indicate a sensitivity to sample size in its early stages, after which it reaches a more stable performance level. The slight upward trend for CUSUM between n=300 and n=500, followed by a decrease, could suggest a more complex relationship with 'n' or potential variability in its error. Overall, the data demonstrates a trade-off between algorithms and their performance as the sample size ('n') increases, with CUSUM and Alg. 1 appearing to be more robust or efficient for larger datasets.