\n
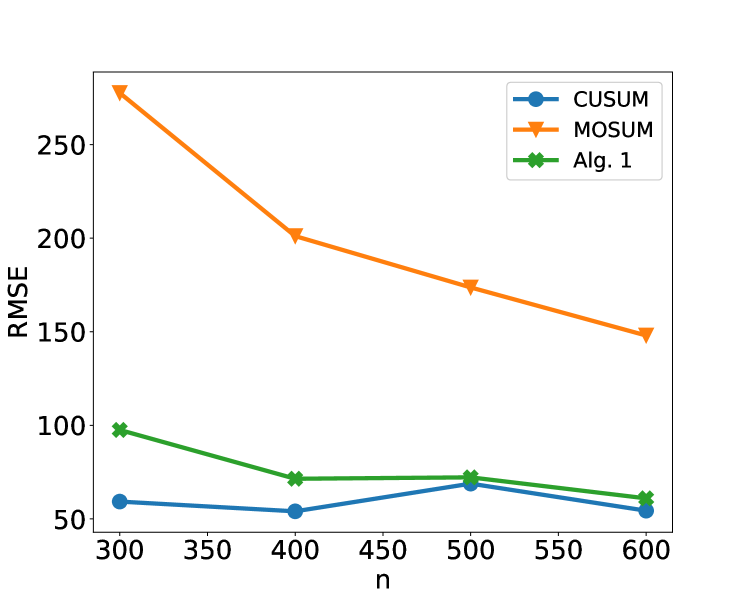
## Line Chart: RMSE vs. Sample Size (n) for Three Algorithms
### Overview
The image is a line chart comparing the Root Mean Square Error (RMSE) of three different algorithms—CUSUM, MOSUM, and Alg. 1—as a function of the sample size or parameter `n`. The chart demonstrates how the error metric changes for each method as `n` increases from 300 to 600.
### Components/Axes
* **Chart Type:** Line chart with markers.
* **X-Axis:**
* **Label:** `n`
* **Scale:** Linear, ranging from 300 to 600.
* **Major Tick Marks:** 300, 350, 400, 450, 500, 550, 600.
* **Y-Axis:**
* **Label:** `RMSE`
* **Scale:** Linear, ranging from approximately 50 to 280.
* **Major Tick Marks:** 50, 100, 150, 200, 250.
* **Legend:**
* **Position:** Top-right corner of the chart area.
* **Entries:**
1. **CUSUM:** Blue line with circle markers.
2. **MOSUM:** Orange line with downward-pointing triangle markers.
3. **Alg. 1:** Green line with star (pentagon) markers.
### Detailed Analysis
**Data Series and Trends:**
1. **MOSUM (Orange Line, Triangle Markers):**
* **Trend:** Shows a strong, consistent downward slope. RMSE decreases significantly as `n` increases.
* **Data Points (Approximate):**
* n=300: RMSE ≈ 280
* n=400: RMSE ≈ 200
* n=500: RMSE ≈ 175
* n=600: RMSE ≈ 150
2. **Alg. 1 (Green Line, Star Markers):**
* **Trend:** Shows a general downward trend, but with a slight increase between n=400 and n=500 before decreasing again.
* **Data Points (Approximate):**
* n=300: RMSE ≈ 100
* n=400: RMSE ≈ 70
* n=500: RMSE ≈ 75
* n=600: RMSE ≈ 60
3. **CUSUM (Blue Line, Circle Markers):**
* **Trend:** Relatively flat with minor fluctuations. It shows the lowest overall RMSE across all values of `n`.
* **Data Points (Approximate):**
* n=300: RMSE ≈ 60
* n=400: RMSE ≈ 55
* n=500: RMSE ≈ 70
* n=600: RMSE ≈ 55
### Key Observations
* **Performance Hierarchy:** For all tested values of `n`, the algorithms rank in performance (from lowest to highest RMSE) as: CUSUM < Alg. 1 < MOSUM.
* **Rate of Improvement:** MOSUM shows the most dramatic improvement (steepest negative slope) as `n` increases. CUSUM shows the least change.
* **Convergence:** The gap between MOSUM and the other two algorithms narrows as `n` increases, but MOSUM's RMSE remains substantially higher.
* **Anomaly:** Alg. 1 exhibits a non-monotonic behavior, with its RMSE increasing slightly at n=500 compared to n=400, before falling again at n=600. CUSUM also shows a small peak at n=500.
### Interpretation
This chart likely evaluates the statistical efficiency or estimation accuracy of three change-point detection or estimation algorithms. The RMSE is a measure of error, so lower values are better.
* **CUSUM** appears to be the most accurate and stable estimator across the range of sample sizes tested, with its error remaining consistently low and relatively unaffected by `n`.
* **MOSUM** is the least accurate but benefits the most from larger sample sizes. Its high initial error suggests it may require more data to perform well, but its strong downward trend indicates it could potentially converge toward the performance of the others with sufficiently large `n`.
* **Alg. 1** occupies a middle ground. Its performance is better than MOSUM but worse than CUSUM. The slight increase in error at n=500 could be due to statistical noise in the experiment or a specific characteristic of the algorithm at that sample size.
The overall message is that algorithm choice significantly impacts error, and the relative advantage of one method over another can depend on the available sample size `n`. CUSUM is robust and accurate for this range, while MOSUM is highly sensitive to `n`.