# Technical Document Analysis of Chart
## Chart Overview
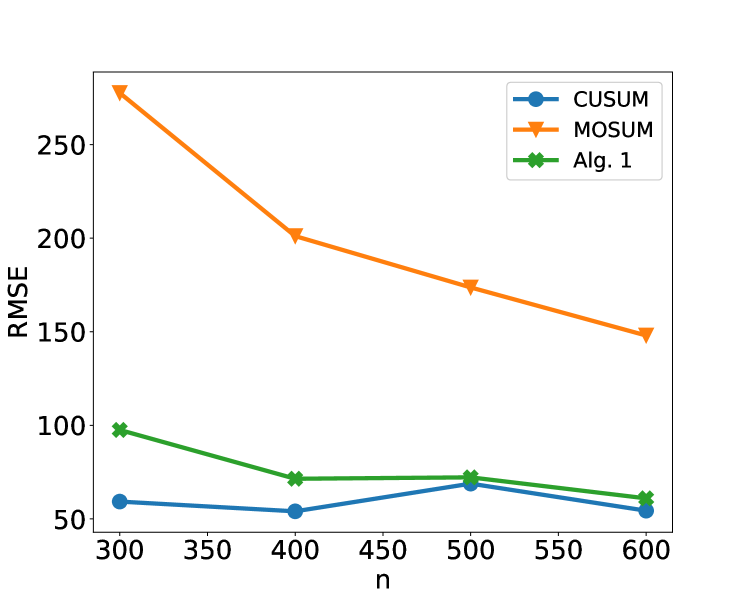
The image is a line chart comparing the Root Mean Square Error (RMSE) performance of three algorithms across varying sample sizes (`n`). The chart includes three data series, each represented by distinct line styles and colors, with a legend for reference.
---
## Key Components
### Legend
- **Location**: Top-right corner of the chart.
- **Labels and Colors**:
- **CUSUM**: Blue line with circular markers (`●`).
- **MOSUM**: Orange line with downward-pointing triangle markers (`▼`).
- **Alg. 1**: Green line with asterisk markers (`★`).
### Axes
- **X-axis (Horizontal)**:
- Label: `n` (sample size).
- Markers: 300, 350, 400, 450, 500, 550, 600.
- **Y-axis (Vertical)**:
- Label: `RMSE` (Root Mean Square Error).
- Markers: 50, 100, 150, 200, 250.
---
## Data Series Analysis
### 1. CUSUM (Blue Line)
- **Trend**:
- Starts at ~60 RMSE at `n=300`.
- Dips to ~50 RMSE at `n=400`.
- Peaks at ~70 RMSE at `n=500`.
- Declines to ~55 RMSE at `n=600`.
- **Key Points**:
- `n=300`: ~60 RMSE.
- `n=400`: ~50 RMSE.
- `n=500`: ~70 RMSE.
- `n=600`: ~55 RMSE.
### 2. MOSUM (Orange Line)
- **Trend**:
- Starts at ~280 RMSE at `n=300`.
- Decreases steadily to ~150 RMSE at `n=600`.
- **Key Points**:
- `n=300`: ~280 RMSE.
- `n=400`: ~200 RMSE.
- `n=500`: ~175 RMSE.
- `n=600`: ~150 RMSE.
### 3. Alg. 1 (Green Line)
- **Trend**:
- Starts at ~100 RMSE at `n=300`.
- Decreases to ~70 RMSE at `n=400`.
- Remains stable (~70 RMSE) at `n=500`.
- Declines to ~60 RMSE at `n=600`.
- **Key Points**:
- `n=300`: ~100 RMSE.
- `n=400`: ~70 RMSE.
- `n=500`: ~70 RMSE.
- `n=600`: ~60 RMSE.
---
## Spatial Grounding
- **Legend Position**: Top-right corner (coordinates: `[x=high, y=high]`).
- **Line-Color Matching**:
- Blue (`●`) = CUSUM.
- Orange (`▼`) = MOSUM.
- Green (`★`) = Alg. 1.
---
## Observations
1. **MOSUM** exhibits the highest RMSE across all `n` values but shows a consistent downward trend.
2. **CUSUM** has the lowest RMSE but shows variability, with a notable peak at `n=500`.
3. **Alg. 1** demonstrates a moderate RMSE, decreasing steadily with a plateau between `n=400` and `n=500`.
---
## Conclusion
The chart illustrates the RMSE performance of three algorithms (CUSUM, MOSUM, Alg. 1) as sample size (`n`) increases. MOSUM starts with the highest error but improves most significantly, while CUSUM maintains the lowest error with minor fluctuations. Alg. 1 shows moderate performance with a gradual decline.