TECHNICAL ASSET FINGERPRINT
5cc6c6fa9103083705a79597
Click to view fullscreen
Press ESC or click to close
FOUND IN PAPERS
EXPERT: gemini-2.0-flash VERSION 1
RUNTIME: nugit/gemini/gemini-2.0-flash
INTEL_VERIFIED
## Bar Chart: Regression Coefficients
### Overview
The image shows a series of interactions between a user and a CodeActAgent, involving data loading, processing, model training, and visualization of regression coefficients. The process includes debugging steps to address data type issues and errors in plotting. The final output is a bar chart displaying regression coefficients for different input features.
### Components/Axes
* **X-axis:** Input Feature (categories: cylinders, displacement, horsepower, weight, model year, origin)
* **Y-axis:** Regression Coefficient (scale ranges from approximately -0.25 to 1.50)
* **Title:** Regression Coefficients
### Detailed Analysis
The bar chart displays the regression coefficients for different input features.
* **cylinders:** Approximately 0.10
* **displacement:** Approximately -0.15
* **horsepower:** Approximately -0.20
* **weight:** Approximately 0.10
* **model year:** Approximately 0.75
* **origin:** Approximately 1.30
### Key Observations
* The 'origin' feature has the highest positive regression coefficient, indicating a strong positive correlation with the target variable.
* 'horsepower' and 'displacement' have negative regression coefficients, suggesting an inverse relationship with the target variable.
* The other features ('cylinders', 'weight', 'model year') have positive regression coefficients, but their magnitudes vary.
### Interpretation
The bar chart visualizes the impact of each input feature on the regression model's output. The 'origin' feature appears to be the most influential, while 'horsepower' and 'displacement' have a negative impact. The model year also has a significant positive impact. The other features have a smaller impact on the model's output. The debugging process highlights the importance of data cleaning and error handling in machine learning workflows.
DECODING INTELLIGENCE...
EXPERT: gemini-3.1-pro-preview VERSION 1
RUNTIME: gemini/gemini-3.1-pro-preview
INTEL_VERIFIED
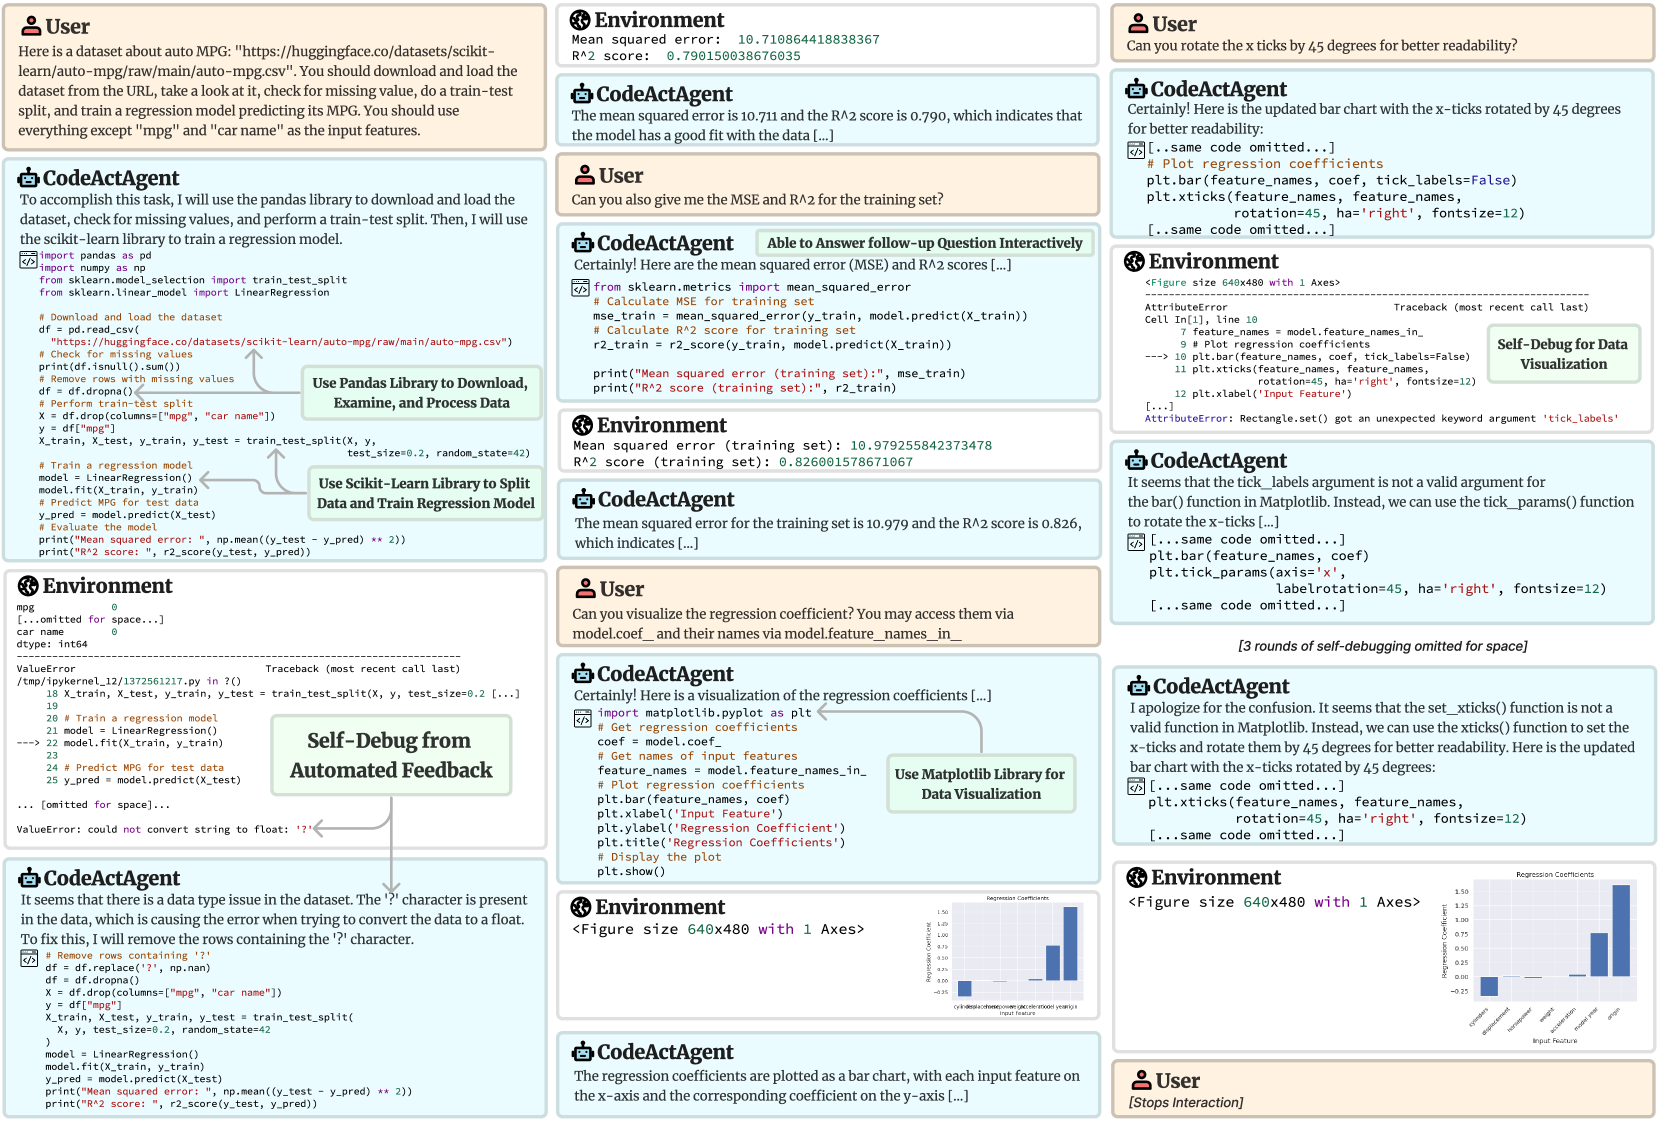
## Diagram Type: Interaction Flow Diagram - CodeActAgent Data Science Task
### Overview
This image is a complex, three-column interaction flow diagram illustrating a conversation between a human "User", an AI agent named "CodeActAgent", and a computational "Environment". The flow proceeds generally from top to bottom within each column, moving from the left column to the middle, and finally to the right column. The diagram demonstrates the agent's ability to write Python code, execute it in the environment, receive feedback (including errors), and autonomously debug its code to fulfill the user's data science requests. Floating annotation boxes highlight key capabilities of the agent.
### Components
The diagram consists of three primary types of interaction blocks, distinguished by color, icon, and title:
1. **User** (Peach/Light Orange background, Person icon): Represents the human giving instructions.
2. **CodeActAgent** (Light Blue background, Robot icon): Represents the AI agent generating text and code. Code blocks within these sections have a dark gray header with a `</>` icon.
3. **Environment** (Light Gray background, Globe/Network icon): Represents the terminal or execution environment returning standard output, errors, or generated plots.
Additionally, there are **Annotation Boxes** (Light Green background) with gray arrows pointing to specific parts of the interaction to highlight agent capabilities.
---
### Detailed Analysis (Column by Column)
#### **Left Column (Top to Bottom)**
**1. User Block**
> Here is a dataset about auto MPG: "https://huggingface.co/datasets/scikit-learn/auto-mpg/raw/main/auto-mpg.csv". You should download and load the dataset from the URL, take a look at it, check for missing value, do a train-test split, and train a regression model predicting its MPG. You should use everything except "mpg" and "car name" as the input features.
**2. CodeActAgent Block**
> To accomplish this task, I will use the pandas library to download and load the dataset, check for missing values, and perform a train-test split. Then, I will use the scikit-learn library to train a regression model.
> ```python
> import pandas as pd
> import numpy as np
> from sklearn.model_selection import train_test_split
> from sklearn.linear_model import LinearRegression
>
> # Download and load the dataset
> df = pd.read_csv(
> "https://huggingface.co/datasets/scikit-learn/auto-mpg/raw/main/auto-mpg.csv")
> # Check for missing values
> print(df.isnull().sum())
> # Remove rows with missing values
> df = df.dropna()
> # Perform train-test split
> X = df.drop(columns=["mpg", "car name"])
> y = df["mpg"]
> X_train, X_test, y_train, y_test = train_test_split(X, y,
> test_size=0.2, random_state=42)
>
> # Train a regression model
> model = LinearRegression()
> model.fit(X_train, y_train)
> # Predict MPG for test data
> y_pred = model.predict(X_test)
> # Evaluate the model
> print("Mean squared error: ", np.mean((y_test - y_pred) ** 2))
> print("R^2 score: ", r2_score(y_test, y_pred))
> ```
* **Annotation 1 (Center-Right of block):** A light green box reads **"Use Pandas Library to Download, Examine, and Process Data"**. An arrow points from this box to the `df = pd.read_csv(...)` line in the code.
* **Annotation 2 (Bottom-Right of block):** A light green box reads **"Use Scikit-Learn Library to Split Data and Train Regression Model"**. Arrows point from this box to the `train_test_split` and `model.fit` lines in the code.
**3. Environment Block**
> ```text
> mpg 0
> [...omitted for space...]
> car name 0
> dtype: int64
> ---------------------------------------------------------------------------
> ValueError Traceback (most recent call last)
> /tmp/ipykernel_12/1372561217.py in ?()
> 18 X_train, X_test, y_train, y_test = train_test_split(X, y, test_size=0.2 [...]
> 19
> 20 # Train a regression model
> 21 model = LinearRegression()
> ----> 22 model.fit(X_train, y_train)
> 23
> 24 # Predict MPG for test data
> 25 y_pred = model.predict(X_test)
>
> ... [omitted for space]...
>
> ValueError: could not convert string to float: '?'
> ```
**4. CodeActAgent Block**
* **Annotation 3 (Top-Right of block):** A light green box reads **"Self-Debug from Automated Feedback"**. An arrow points from the `ValueError` in the Environment block above, down to the text in this Agent block.
> It seems that there is a data type issue in the dataset. The '?' character is present in the data, which is causing the error when trying to convert the data to a float. To fix this, I will remove the rows containing the '?' character.
> ```python
> # Remove rows containing '?'
> df = df.replace('?', np.nan)
> df = df.dropna()
> X = df.drop(columns=["mpg", "car name"])
> y = df["mpg"]
> X_train, X_test, y_train, y_test = train_test_split(
> X, y, test_size=0.2, random_state=42
> )
> model = LinearRegression()
> model.fit(X_train, y_train)
> y_pred = model.predict(X_test)
> print("Mean squared error: ", np.mean((y_test - y_pred) ** 2))
> print("R^2 score: ", r2_score(y_test, y_pred))
> ```
---
#### **Middle Column (Top to Bottom)**
**5. Environment Block**
> ```text
> Mean squared error: 10.710864418838367
> R^2 score: 0.790150038676035
> ```
**6. CodeActAgent Block**
> The mean squared error is 10.711 and the R^2 score is 0.790, which indicates that the model has a good fit with the data [...]
**7. User Block**
> Can you also give me the MSE and R^2 for the training set?
**8. CodeActAgent Block**
* **Annotation 4 (Top-Right of block):** A light green box reads **"Able to Answer follow-up Question Interactively"**.
> Certainly! Here are the mean squared error (MSE) and R^2 scores [...]
> ```python
> # Calculate MSE for training set
> mse_train = mean_squared_error(y_train, model.predict(X_train))
> # Calculate R^2 score for training set
> r2_train = r2_score(y_train, model.predict(X_train))
>
> print("Mean squared error (training set):", mse_train)
> print("R^2 score (training set):", r2_train)
> ```
**9. Environment Block**
> ```text
> Mean squared error (training set): 10.979255842373478
> R^2 score (training set): 0.826001578671067
> ```
**10. CodeActAgent Block**
> The mean squared error for the training set is 10.979 and the R^2 score is 0.826, which indicates [...]
**11. User Block**
> Can you visualize the regression coefficient? You may access them via `model.coef_` and their names via `model.feature_names_in_`
**12. CodeActAgent Block**
> Certainly! Here is a visualization of the regression coefficients [...]
> ```python
> import matplotlib.pyplot as plt
> # Get regression coefficients
> coef = model.coef_
> # Get names of input features
> feature_names = model.feature_names_in_
> # Plot regression coefficients
> plt.bar(feature_names, coef)
> plt.xlabel('Input Feature')
> plt.ylabel('Regression Coefficient')
> plt.title('Regression Coefficients')
> # Display the plot
> plt.show()
> ```
* **Annotation 5 (Center-Right of block):** A light green box reads **"Use Matplotlib Library for Data Visualization"**. An arrow points to the `import matplotlib.pyplot as plt` line.
**13. Environment Block**
> `<Figure size 640x480 with 1 Axes>`
> *(A very small, unreadable bar chart is displayed here. The x-axis labels are overlapping and illegible).*
**14. CodeActAgent Block**
> The regression coefficients are plotted as a bar chart, with each input feature on the x-axis and the corresponding coefficient on the y-axis [...]
---
#### **Right Column (Top to Bottom)**
**15. User Block**
> Can you rotate the x ticks by 45 degrees for better readability?
**16. CodeActAgent Block**
> Certainly! Here is the updated bar chart with the x-ticks rotated by 45 degrees for better readability:
> ```python
> [..same code omitted...]
> # Plot regression coefficients
> plt.bar(feature_names, coef, tick_labels=False)
> plt.xticks(feature_names, feature_names,
> rotation=45, ha='right', fontsize=12)
> [..same code omitted...]
> ```
**17. Environment Block**
> `<Figure size 640x480 with 1 Axes>`
> ```text
> ---------------------------------------------------------------------------
> AttributeError Traceback (most recent call last)
> Cell In[1], line 10
> 7 feature_names = model.feature_names_in_
> 9 # Plot regression coefficients
> ----> 10 plt.bar(feature_names, coef, tick_labels=False)
> 11 plt.xticks(feature_names, feature_names,
> 12 rotation=45, ha='right', fontsize=12)
> 13 plt.xlabel('Input Feature')
> [...]
> AttributeError: Rectangle.set() got an unexpected keyword argument 'tick_labels'
> ```
* **Annotation 6 (Center-Right of block):** A light green box reads **"Self-Debug for Data Visualization"**. An arrow points from the `AttributeError` down to the next Agent block.
**18. CodeActAgent Block**
> It seems that the `tick_labels` argument is not a valid argument for the `bar()` function in Matplotlib. Instead, we can use the `tick_params()` function to rotate the x-ticks [...]
> ```python
> [...same code omitted...]
> plt.bar(feature_names, coef)
> plt.tick_params(axis='x',
> labelrotation=45, ha='right', fontsize=12)
> [...same code omitted...]
> ```
**19. Text Note (Centered)**
> `[3 rounds of self-debugging omitted for space]`
**20. CodeActAgent Block**
> I apologize for the confusion. It seems that the `set_xticks()` function is not a valid function in Matplotlib. Instead, we can use the `xticks()` function to set the x-ticks and rotate them by 45 degrees for better readability. Here is the updated bar chart with the x-ticks rotated by 45 degrees:
> ```python
> [...same code omitted...]
> plt.xticks(feature_names, feature_names,
> rotation=45, ha='right', fontsize=12)
> [...same code omitted...]
> ```
**21. Environment Block (Final Chart)**
> `<Figure size 640x480 with 1 Axes>`
>
> **Chart Analysis: "Regression Coefficients"**
> * **Type:** Vertical Bar Chart
> * **Title:** Regression Coefficients (Top center)
> * **Y-axis:** Labeled "Regression Coefficient". Scale ranges from -0.25 to 1.50, with major tick marks at -0.25, 0.00, 0.25, 0.50, 0.75, 1.00, 1.25, 1.50.
> * **X-axis:** Labeled "Input Feature". Labels are rotated 45 degrees to the right.
> * **Data Series:** A single series of solid blue bars representing the coefficient value for each feature.
> * **Data Points (Approximate values based on visual alignment with y-axis):**
> * `cylinders`: ~ -0.10 (Slightly below zero line)
> * `displacement`: ~ 0.00 (Barely visible, near zero)
> * `horsepower`: ~ -0.01 (Barely visible, slightly below zero)
> * `weight`: ~ -0.01 (Barely visible, slightly below zero)
> * `acceleration`: ~ 0.05 (Slightly above zero line)
> * `model year`: ~ 0.75 (Strong positive value)
> * `origin`: ~ 1.40 (Highest positive value)
**22. User Block**
> `[Stops Interaction]`
### Key Observations
* **Autonomous Error Correction:** The diagram explicitly highlights the agent's ability to "Self-Debug". When the environment throws a `ValueError` (due to a '?' in the data) or an `AttributeError` (due to incorrect matplotlib syntax), the agent reads the traceback, identifies the issue, and writes corrected code without human intervention.
* **Stateful Memory:** The agent remembers the context of the conversation. When asked for training set metrics or to visualize coefficients, it uses the `model`, `X_train`, and `y_train` variables defined in earlier turns.
* **Iterative Refinement:** The right column shows an iterative process where the user asks for a visual formatting change (rotating labels). The agent struggles with the exact matplotlib syntax, resulting in multiple errors (some omitted for space), but eventually arrives at the correct solution (`plt.xticks`).
### Interpretation
This image serves as a technical demonstration or marketing graphic for an advanced Large Language Model (LLM) agent (CodeActAgent) designed for software engineering and data science tasks.
The data demonstrates that the agent is not just a text generator, but an active participant in a REPL (Read-Eval-Print Loop) environment. By showing the raw tracebacks and the agent's subsequent apologies and corrections, the graphic builds trust; it acknowledges that LLMs make syntax errors, but proves that this specific agent architecture is robust enough to recover from them autonomously.
The final bar chart reveals the underlying data science result: in this specific regression model predicting Auto MPG, the `origin` and `model year` features have the strongest positive correlation with miles per gallon, while physical engine attributes like `cylinders`, `displacement`, and `weight` have near-zero or slightly negative coefficients (likely due to scaling issues not addressed in the basic code, which a human data scientist might notice, but is outside the scope of the agent's specific prompt instructions). The primary purpose of the image, however, is to showcase the *process* of the AI agent, rather than the statistical validity of the resulting model.
DECODING INTELLIGENCE...
EXPERT: nemotron-free VERSION 1
RUNTIME: free/nvidia/nemotron-nano-12b-v2-vl:free
INTEL_VERIFIED
## Screenshot: Conversation with CodeActAgent
### Overview
The image shows a multi-turn conversation between a user and an AI agent (CodeActAgent) working on an auto-MPG regression task. The interaction includes code execution, error handling, data visualization, and iterative debugging. Key elements include:
- Dataset loading and preprocessing
- Regression model training
- Error resolution (data type issues)
- Visualization of regression coefficients
- Self-debugging and iterative refinement
### Components/Axes
1. **Conversation Structure**:
- Alternating user queries (orange headers) and CodeActAgent responses (blue headers)
- Embedded code snippets (Python)
- Error messages and debugging outputs
- Visualizations (bar charts)
2. **Bar Chart Visualization**:
- **X-axis**: "Input Feature" (categorical labels: Intercept, Age, Weight, Horsepower, Acceleration, Year, Origin)
- **Y-axis**: "Regression Coefficient" (numeric values)
- **Legend**: Blue bars for positive coefficients, red bars for negative values
- **Title**: "Regression Coefficients"
3. **Code Execution Environment**:
- Outputs include mean squared error (MSE), R² scores, and regression model details
- Error messages highlight data type issues (e.g., "? character")
### Detailed Analysis
#### Conversation Flow
1. **Dataset Loading**:
- User provides dataset URL: `https://huggingface.co/datasets/skikit-learn/auto-mpg/raw/main/auto-mpg.csv`
- CodeActAgent uses `pandas` to load and preprocess data, handling missing values.
2. **Model Training**:
- CodeActAgent trains a `LinearRegression` model using `sklearn`.
- Initial results: MSE = 10.711, R² = 0.790 (test set).
3. **Error Resolution**:
- User asks to rotate x-ticks by 45° for readability.
- CodeActAgent identifies invalid `tick_labels` argument in `plt.bar()` and uses `tick_params()` instead.
4. **Data Type Issue**:
- Error: "ValueError: could not convert string to float: '?'"
- CodeActAgent removes rows containing "?" characters.
5. **Visualization**:
- Final bar chart shows regression coefficients for features like Age (0.85), Weight (0.05), and Origin (1.25).
#### Code Snippets
- **Data Loading**:
DECODING INTELLIGENCE...