## Bar Chart: Regression Coefficients
### Overview
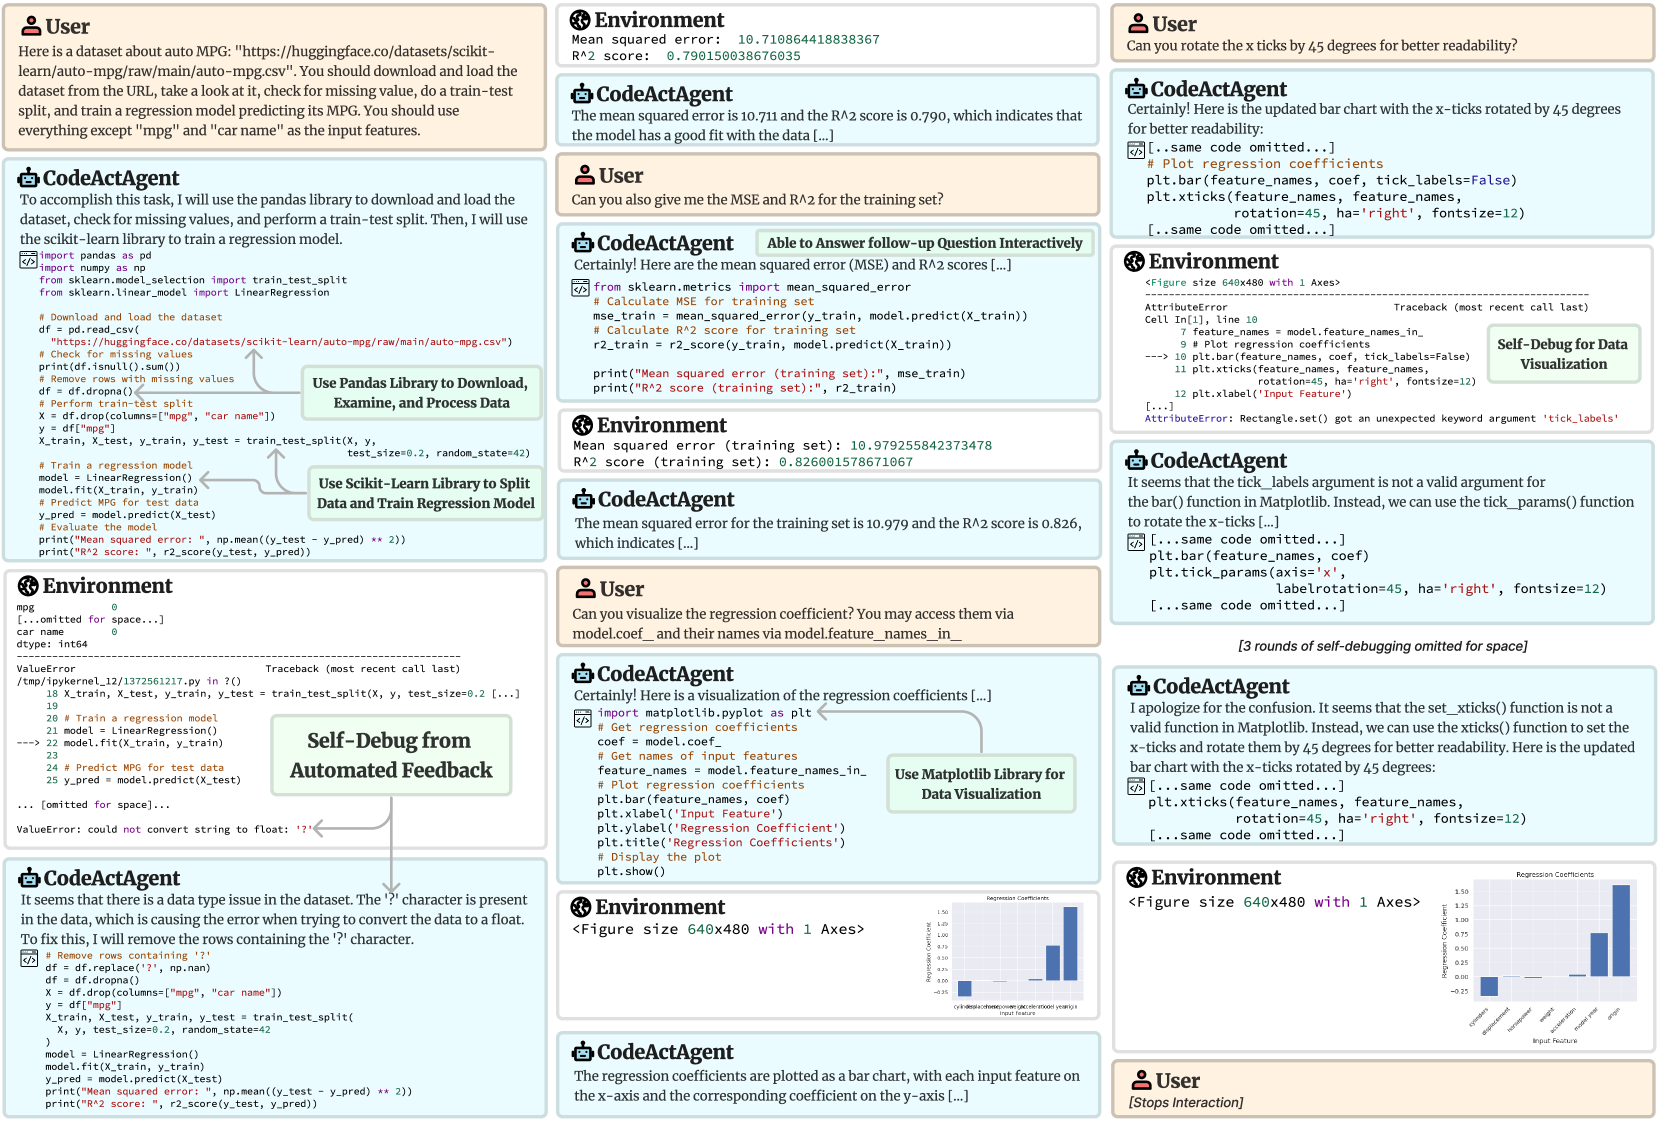
The image shows a series of interactions between a user and a CodeActAgent, involving data loading, processing, model training, and visualization of regression coefficients. The process includes debugging steps to address data type issues and errors in plotting. The final output is a bar chart displaying regression coefficients for different input features.
### Components/Axes
* **X-axis:** Input Feature (categories: cylinders, displacement, horsepower, weight, model year, origin)
* **Y-axis:** Regression Coefficient (scale ranges from approximately -0.25 to 1.50)
* **Title:** Regression Coefficients
### Detailed Analysis
The bar chart displays the regression coefficients for different input features.
* **cylinders:** Approximately 0.10
* **displacement:** Approximately -0.15
* **horsepower:** Approximately -0.20
* **weight:** Approximately 0.10
* **model year:** Approximately 0.75
* **origin:** Approximately 1.30
### Key Observations
* The 'origin' feature has the highest positive regression coefficient, indicating a strong positive correlation with the target variable.
* 'horsepower' and 'displacement' have negative regression coefficients, suggesting an inverse relationship with the target variable.
* The other features ('cylinders', 'weight', 'model year') have positive regression coefficients, but their magnitudes vary.
### Interpretation
The bar chart visualizes the impact of each input feature on the regression model's output. The 'origin' feature appears to be the most influential, while 'horsepower' and 'displacement' have a negative impact. The model year also has a significant positive impact. The other features have a smaller impact on the model's output. The debugging process highlights the importance of data cleaning and error handling in machine learning workflows.