\n
## Line Chart: Build Duration vs. Number of Jobs
### Overview
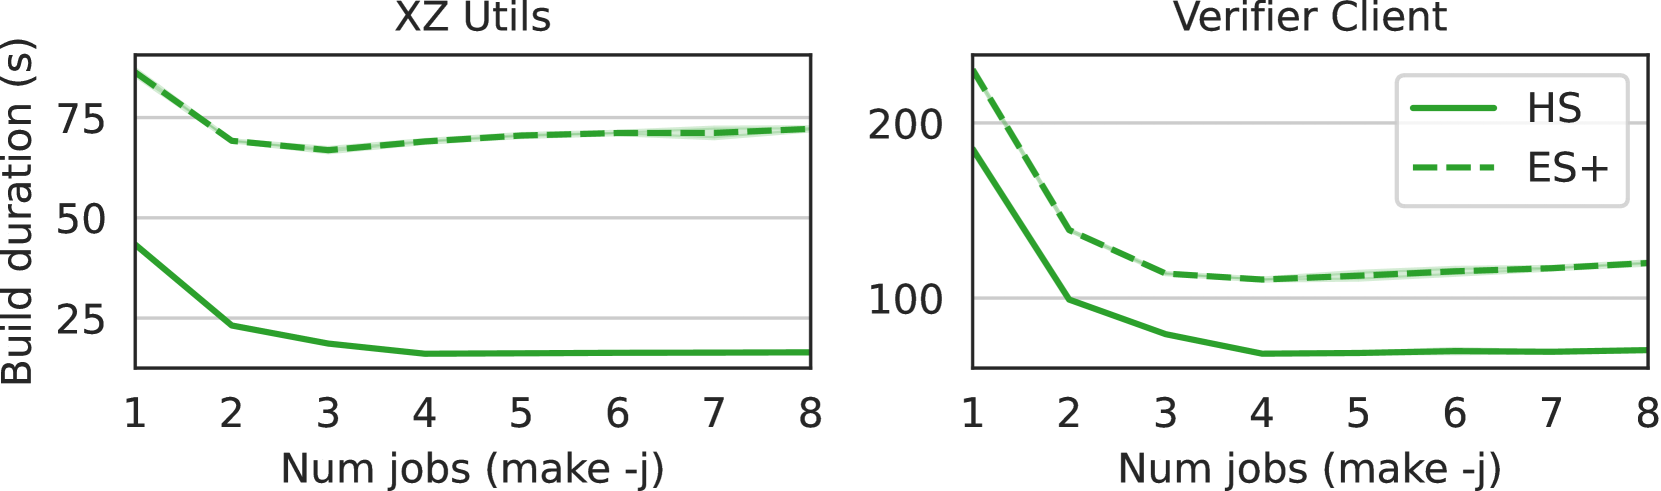
The image presents two line charts comparing build duration (in seconds) against the number of jobs (using the `make -j` command). The left chart focuses on "XZ Utils", while the right chart focuses on "Verifier Client". Each chart displays two data series, distinguished by line style and color, representing different configurations: "HS" (solid line) and "ES+" (dashed line).
### Components/Axes
* **X-axis (both charts):** "Num jobs (make -j)" with values ranging from 1 to 8.
* **Y-axis (left chart):** "Build duration (s)" with a scale from 0 to 80, incrementing by 20.
* **Y-axis (right chart):** "Build duration (s)" with a scale from 0 to 220, incrementing by 50.
* **Legend (top-right of each chart):**
* Green solid line: "HS"
* Green dashed line: "ES+"
* **Titles:**
* Left chart: "XZ Utils" (top-left)
* Right chart: "Verifier Client" (top-left)
### Detailed Analysis or Content Details
**XZ Utils Chart:**
* **HS (Green Solid Line):** The line slopes downward sharply from x=1 to x=2, decreasing from approximately 70 seconds to 25 seconds. It then plateaus, remaining relatively constant at around 20-25 seconds for x values from 2 to 8.
* x=1: ~70s
* x=2: ~25s
* x=3: ~22s
* x=4: ~22s
* x=5: ~22s
* x=6: ~22s
* x=7: ~22s
* x=8: ~22s
* **ES+ (Green Dashed Line):** The line starts at approximately 65 seconds at x=1 and decreases gradually to around 60 seconds at x=2. It remains relatively stable between 60 and 70 seconds for x values from 2 to 8.
* x=1: ~65s
* x=2: ~62s
* x=3: ~63s
* x=4: ~63s
* x=5: ~63s
* x=6: ~63s
* x=7: ~63s
* x=8: ~63s
**Verifier Client Chart:**
* **HS (Green Solid Line):** The line exhibits a steep downward slope from x=1 to x=3, decreasing from approximately 200 seconds to 20 seconds. It then plateaus, remaining around 20 seconds for x values from 3 to 8.
* x=1: ~200s
* x=2: ~90s
* x=3: ~20s
* x=4: ~20s
* x=5: ~20s
* x=6: ~20s
* x=7: ~20s
* x=8: ~20s
* **ES+ (Green Dashed Line):** The line also shows a steep downward slope from x=1 to x=3, decreasing from approximately 150 seconds to 50 seconds. It then levels off, remaining between 50 and 60 seconds for x values from 3 to 8.
* x=1: ~150s
* x=2: ~80s
* x=3: ~50s
* x=4: ~55s
* x=5: ~55s
* x=6: ~55s
* x=7: ~55s
* x=8: ~55s
### Key Observations
* Both "HS" and "ES+" configurations show decreasing build durations as the number of jobs increases, up to a certain point.
* The "Verifier Client" build durations are significantly longer than those of "XZ Utils" for the same number of jobs, especially at x=1.
* The benefit of increasing the number of jobs diminishes after a certain point (around x=2 or x=3), as the build duration plateaus.
* "HS" consistently outperforms "ES+" in terms of build duration for both "XZ Utils" and "Verifier Client".
### Interpretation
The data suggests that parallelizing the build process using `make -j` can significantly reduce build duration, but there are diminishing returns. The optimal number of jobs appears to be around 2 or 3 for both "XZ Utils" and "Verifier Client". The difference in build durations between the two projects indicates that "Verifier Client" is a more computationally intensive build process. The consistent outperformance of "HS" over "ES+" suggests that the "HS" configuration is more efficient for these builds, potentially due to better resource allocation or optimization. The steep initial decline in build duration likely represents the benefits of utilizing multiple CPU cores, while the plateau indicates that the build process is becoming limited by other factors, such as disk I/O or memory bandwidth. The charts provide valuable insights for optimizing build processes and selecting appropriate configurations for different projects.