## Line Graphs: Build Duration vs. Number of Jobs (make -j)
### Overview
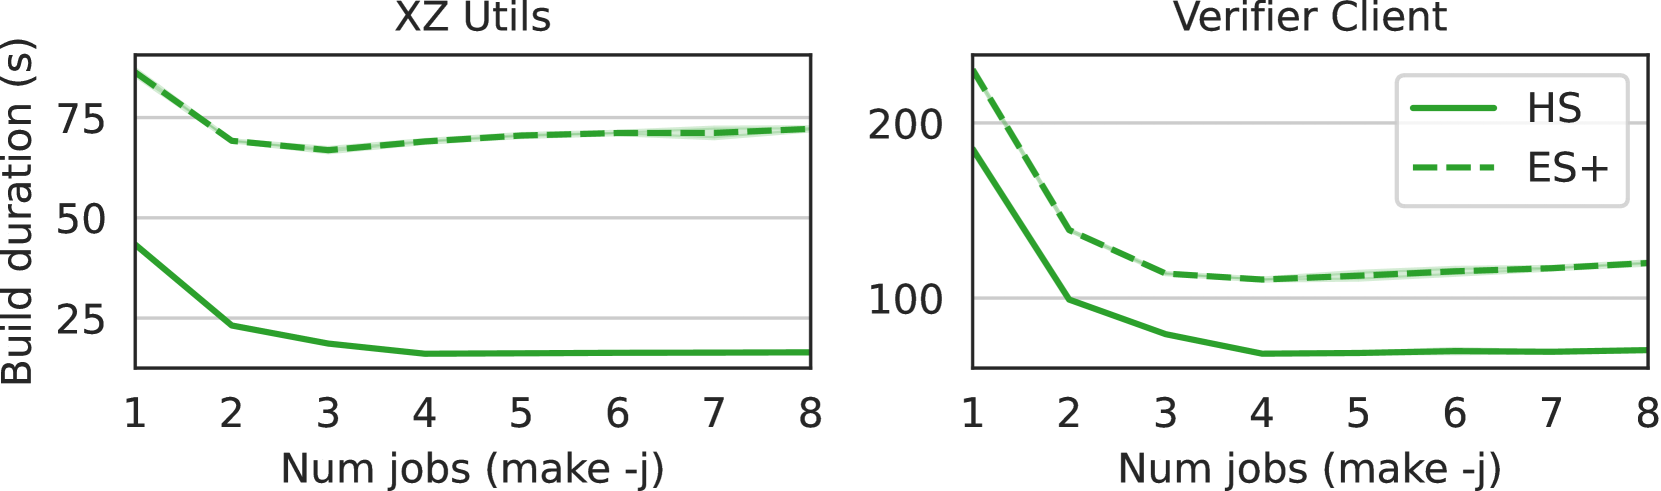
The image contains two line graphs comparing build durations for two software components ("XZ Utils" and "Verifier Client") across varying numbers of parallel jobs (1–8). Each graph includes two data series: "HS" (solid green line) and "ES+" (dashed green line). The y-axis represents build duration in seconds, while the x-axis represents the number of jobs.
---
### Components/Axes
1. **XZ Utils Graph**:
- **X-axis**: "Num jobs (make -j)" (1–8).
- **Y-axis**: "Build duration (s)" (0–75s, linear scale).
- **Legend**:
- Solid green: "HS"
- Dashed green: "ES+"
- **Legend Position**: Top-right corner.
2. **Verifier Client Graph**:
- **X-axis**: "Num jobs (make -j)" (1–8).
- **Y-axis**: "Build duration (s)" (0–200s, linear scale).
- **Legend**:
- Solid green: "HS"
- Dashed green: "ES+"
- **Legend Position**: Top-right corner.
---
### Detailed Analysis
#### XZ Utils Graph
- **HS (Solid Green)**:
- Starts at ~75s for 1 job.
- Drops sharply to ~25s at 2 jobs.
- Plateaus at ~25s for jobs 3–8.
- **ES+ (Dashed Green)**:
- Starts at ~150s for 1 job.
- Decreases to ~75s at 2 jobs.
- Stabilizes at ~75s for jobs 3–8.
#### Verifier Client Graph
- **HS (Solid Green)**:
- Starts at ~200s for 1 job.
- Drops to ~100s at 2 jobs.
- Remains flat at ~100s for jobs 3–8.
- **ES+ (Dashed Green)**:
- Starts at ~250s for 1 job.
- Decreases to ~125s at 2 jobs.
- Stabilizes at ~125s for jobs 3–8.
---
### Key Observations
1. **Initial Job Impact**: Both data series show a steep decline in build duration when increasing jobs from 1 to 2.
2. **Diminishing Returns**: After 2 jobs, build durations stabilize, indicating minimal improvement with additional jobs.
3. **Performance Gap**: "ES+" consistently has longer build durations than "HS" in both graphs.
4. **Scale Differences**: The Verifier Client graph uses a larger y-axis scale (0–200s) compared to XZ Utils (0–75s), reflecting inherently longer build times.
---
### Interpretation
- **Parallel Job Efficiency**: The sharp decline in build duration for the first two jobs suggests that parallelism significantly reduces build times, but adding more jobs yields diminishing returns.
- **Component Complexity**: The Verifier Client’s longer build times (e.g., ~200s vs. ~75s for XZ Utils) imply it is computationally more intensive.
- **Algorithm/Implementation Differences**: The persistent gap between "HS" and "ES+" may reflect differences in code optimization, dependencies, or resource utilization between the two components.
- **Practical Implication**: For both components, using 2 jobs is likely optimal, as further parallelization does not meaningfully reduce build duration.
---
### Spatial Grounding & Trend Verification
- **Legend Alignment**: Both legends are positioned in the top-right corner, matching the color coding (solid green = HS, dashed green = ES+).
- **Trend Consistency**: The observed trends (sharp decline followed by plateau) align with the visual slopes of the lines in both graphs.