\n
## Diagram: Trajectory-Response Data - Fourier Transform Question
### Overview
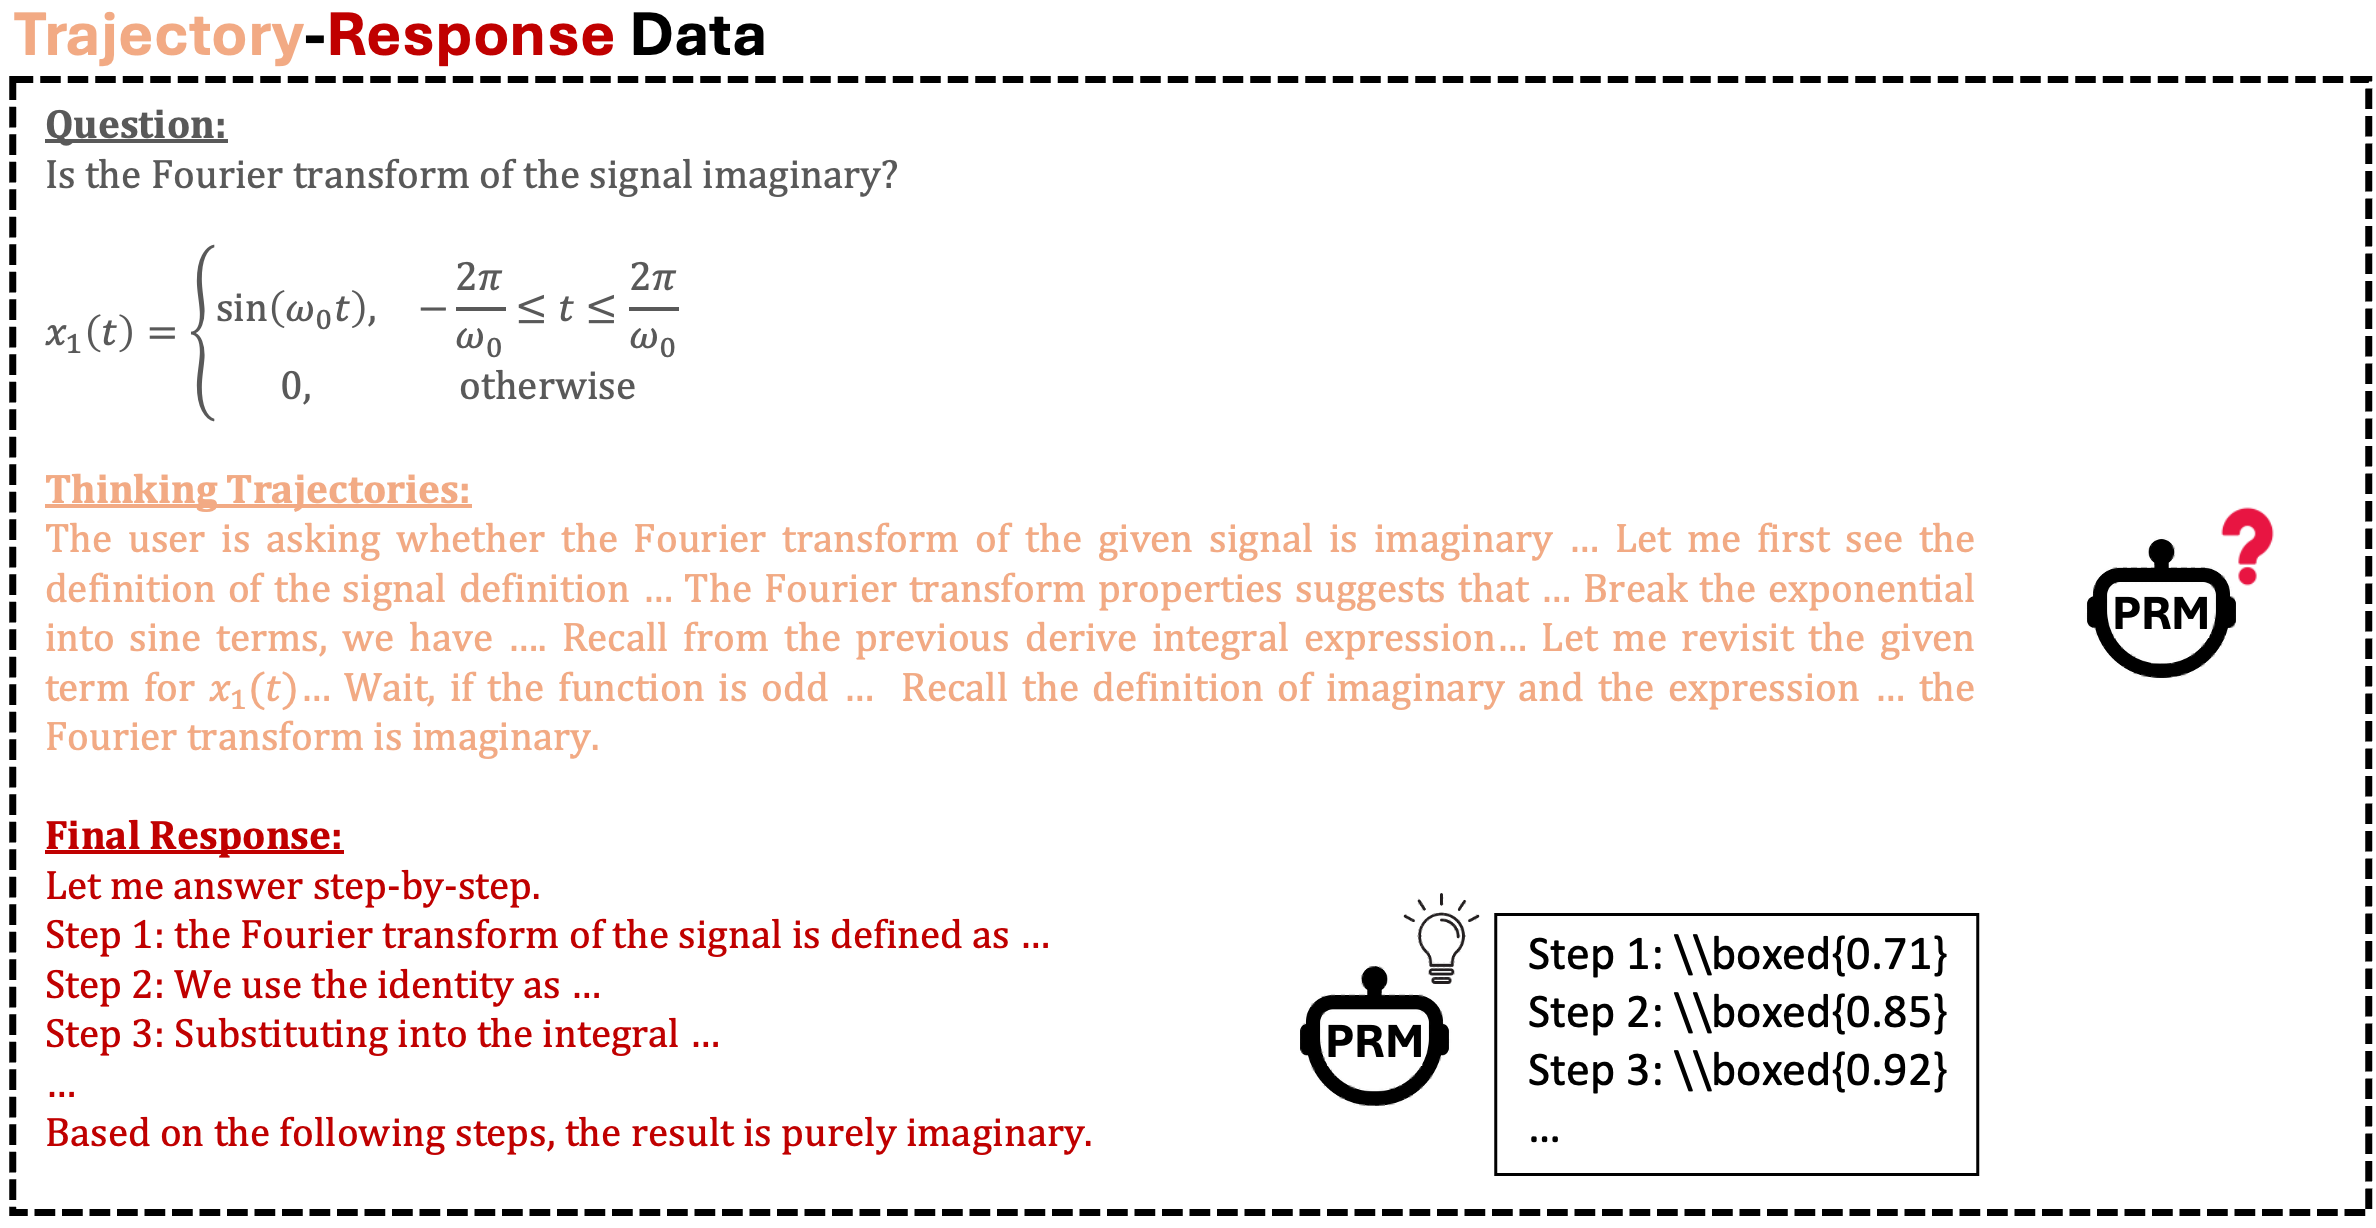
This diagram presents a question regarding the Fourier transform of a signal, along with a visual representation of the thought process used to arrive at a solution. It mimics a conversational AI interface, showing "Thinking Trajectories" and a "Final Response" section. The diagram includes a mathematical definition of the signal, intermediate steps, and visual cues (icons) to indicate progress.
### Components/Axes
The diagram is structured into several key components:
* **Header:** "Trajectory-Response Data"
* **Question:** "Is the Fourier transform of the signal imaginary?"
* **Signal Definition:** `x₁(t) = { sin(ω₀t), -π/ω₀ ≤ t ≤ π/ω₀; 0, otherwise }`
* **Thinking Trajectories:** A block of text simulating the reasoning process.
* **Final Response:** A step-by-step solution.
* **Icons:** Two icons labeled "PRM" (one with a question mark, one with a lightbulb) are present.
* **Step Boxes:** Three boxes labeled "Step 1", "Step 2", and "Step 3" containing values enclosed in `\boxed{}`.
### Detailed Analysis or Content Details
**Signal Definition:**
The signal `x₁(t)` is defined as follows:
* `sin(ω₀t)` for `-π/ω₀ ≤ t ≤ π/ω₀`
* `0` otherwise.
**Thinking Trajectories (Transcription):**
"The user is asking whether the Fourier transform of the given signal is imaginary … Let me first see the definition of the signal definition … The Fourier transform properties suggests that … Break the exponential into sine terms, we have … Recall from the previous derive integral expression… Let me revisit the given term for x₁(t)… Wait, if the function is odd … Recall the definition of imaginary and the expression … the Fourier transform is imaginary."
**Final Response (Transcription):**
"Let me answer step-by-step.
Step 1: The Fourier transform of the signal is defined as …
Step 2: We use the identity as …
Step 3: Substituting into the integral …
Based on the following steps, the result is purely imaginary."
**Step Boxes:**
* Step 1: `\boxed{0.71}`
* Step 2: `\boxed{0.85}`
* Step 3: `\boxed{0.92}`
**Icon Placement:**
* The "PRM" icon with a question mark is located in the top-right corner of the "Thinking Trajectories" section.
* The "PRM" icon with a lightbulb is located in the bottom-right corner of the "Final Response" section.
### Key Observations
* The diagram presents a problem-solving process, not a dataset to analyze.
* The values in the step boxes (0.71, 0.85, 0.92) appear to be intermediate results in the calculation, but their specific meaning is not explicitly stated.
* The "Thinking Trajectories" section provides insight into the reasoning behind the solution.
* The use of icons and step-by-step formatting aims to make the solution more accessible.
### Interpretation
The diagram illustrates a typical approach to solving a mathematical problem, particularly in the context of signal processing. The "Thinking Trajectories" section demonstrates the iterative nature of problem-solving, where the solver revisits definitions, applies properties, and considers different approaches. The "Final Response" section provides a structured solution, breaking down the problem into manageable steps. The values in the step boxes likely represent intermediate calculations within the Fourier transform derivation. The diagram suggests that the Fourier transform of the given signal is indeed purely imaginary, as indicated by the final statement. The PRM icons likely represent a process or agent (possibly "Problem Reasoning Module") guiding the solution. The diagram is a visual representation of an AI's thought process, rather than a presentation of empirical data.