# Technical Document Extraction: Probability Density Function Graph
## **Graph Overview**
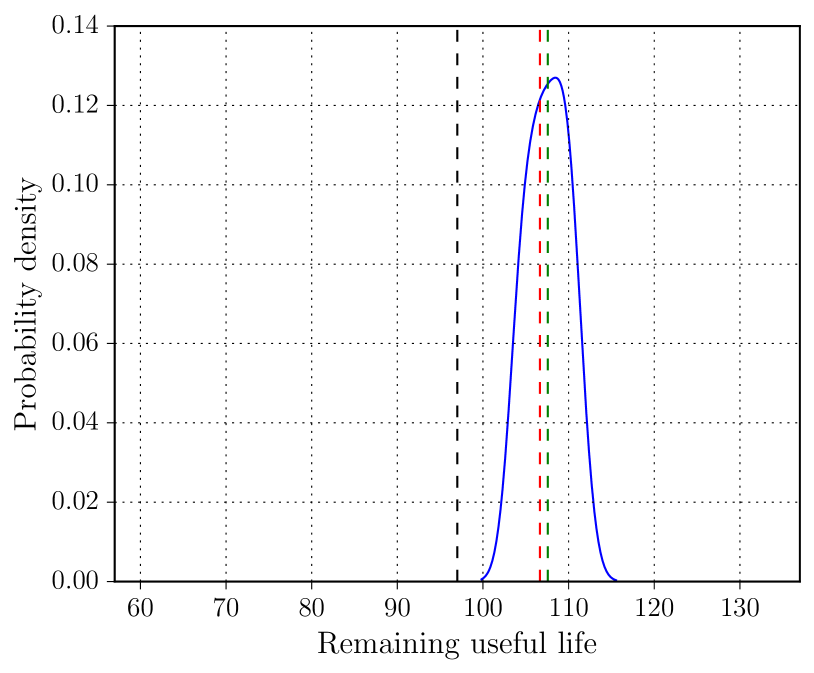
The image depicts a probability density function (PDF) graph illustrating the distribution of "Remaining useful life" with associated probability density values. Key components include labeled axes, a probability density curve, and threshold markers.
---
## **Axis Labels and Markers**
- **X-Axis (Horizontal):**
- Label: *"Remaining useful life"*
- Range: 60 to 130 (in increments of 10)
- Tick marks: 60, 70, 80, 90, 100, 110, 120, 130
- **Y-Axis (Vertical):**
- Label: *"Probability density"*
- Range: 0.00 to 0.14 (in increments of 0.02)
- Tick marks: 0.00, 0.02, 0.04, 0.06, 0.08, 0.10, 0.12, 0.14
---
## **Legend and Data Series**
- **Legend (Right Side):**
- **Blue Line:** *"Remaining useful life"* (main probability density curve)
- **Red/Green Dashed Lines:** *"Acceptance criteria"* (threshold markers)
---
## **Key Data Points and Trends**
1. **Probability Density Curve (Blue):**
- **Shape:** Symmetric, bell-shaped curve (normal distribution).
- **Peak:**
- X-value: 110
- Y-value: ~0.125 (highest probability density)
- **Trend:**
- Increases from 60 to 110, then decreases symmetrically to 130.
- Probability density approaches 0 at both extremes (60 and 130).
2. **Threshold Markers:**
- **Black Dashed Line:**
- X-value: 100
- Purpose: Likely a lower bound or operational threshold.
- **Red/Green Dashed Lines:**
- X-value: 110 (aligned with the peak of the blue curve)
- Purpose: Acceptance criteria for "Remaining useful life."
---
## **Spatial Grounding and Color Verification**
- **Legend Placement:** Right side of the graph, outside the main chart area.
- **Color Consistency:**
- Blue line matches the legend label *"Remaining useful life."*
- Red/green dashed lines match the legend label *"Acceptance criteria."*
---
## **Additional Observations**
- No numerical data table is present; all information is derived from the graph.
- No text in languages other than English is visible.
- The graph does not include a title or subtitle.
---
## **Summary**
The graph models the probability density of "Remaining useful life," peaking at 110 with a maximum density of ~0.125. Thresholds at 100 (black) and 110 (red/green) demarcate operational and acceptance criteria, respectively. The blue curve represents the distribution, while dashed lines indicate critical decision points.