# Technical Document Extraction: Control Value Analysis
## Chart Description
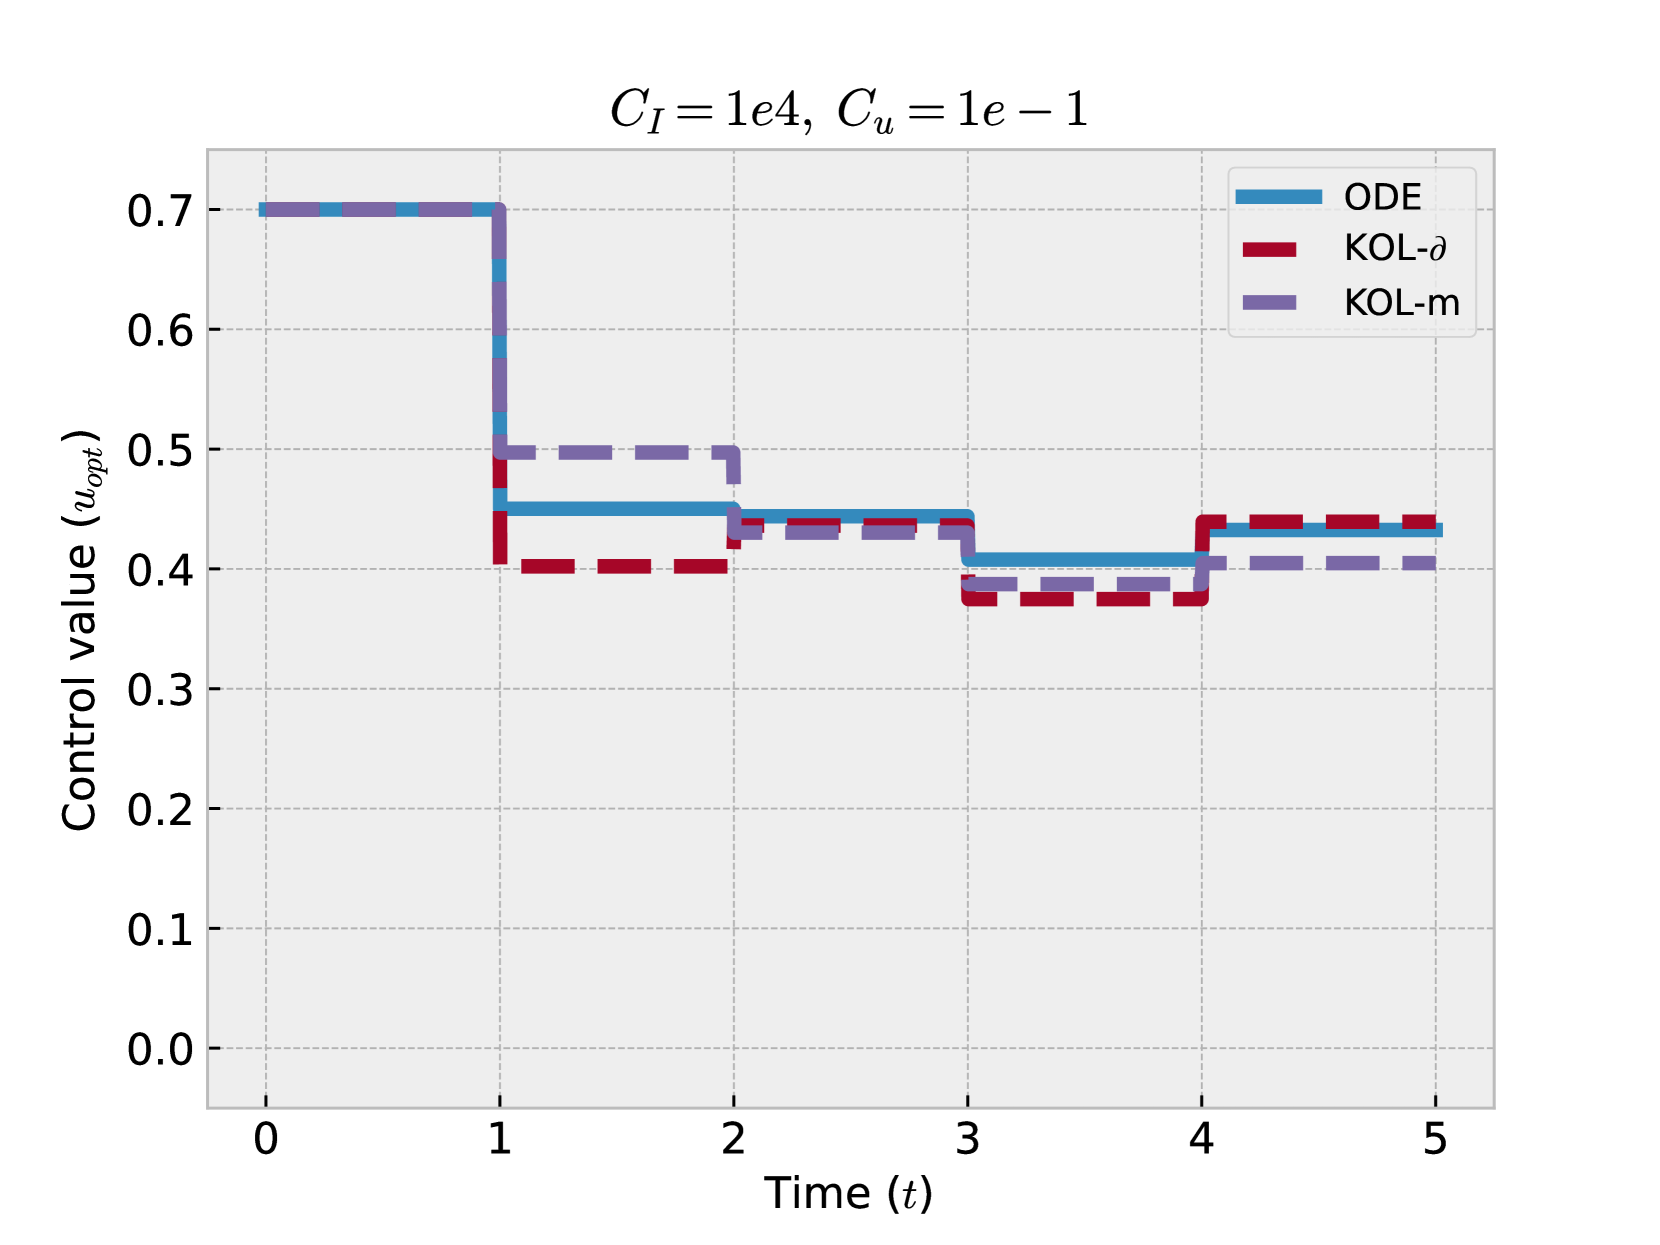
This image depicts a line chart analyzing control values over time under specific parameter conditions. The chart includes three distinct control strategies represented by colored lines, with precise numerical annotations for key data points.
---
## Axis Labels and Scales
- **X-axis (Time, t):**
- Range: 0 to 5 (unitless)
- Markers: Integer ticks at 0, 1, 2, 3, 4, 5
- **Y-axis (Control value, u_opt):**
- Range: 0.0 to 0.7 (unitless)
- Markers: Incremental ticks at 0.0, 0.1, 0.2, 0.3, 0.4, 0.5, 0.6, 0.7
---
## Chart Title and Parameters
- **Title:**
`C_I = 1e4, C_u = 1e-1`
(Indicates system parameters for the control analysis)
---
## Legend and Line Definitions
| Color | Label | Line Style |
|---------|-----------|------------------|
| Blue | ODE | Solid |
| Red | KOL-δ | Dashed |
| Purple | KOL-m | Dash-dot |
---
## Key Data Trends
### ODE (Blue Solid Line)
- **Initial Value (t=0):** 0.7
- **Step Down (t=1):** Drops to 0.4
- **Stable Phase (t=1–3):** Maintains 0.4
- **Slight Rise (t=4):** Increases to 0.45
- **Final Value (t=5):** Returns to 0.4
### KOL-δ (Red Dashed Line)
- **Initial Value (t=0):** 0.4
- **Step Down (t=1):** Drops to 0.35
- **Stable Phase (t=1–3):** Maintains 0.35
- **Rise (t=4):** Increases to 0.4
- **Final Value (t=5):** Maintains 0.4
### KOL-m (Purple Dash-Dot Line)
- **Initial Value (t=0):** 0.7
- **Step Down (t=1):** Drops to 0.5
- **Stable Phase (t=1–3):** Maintains 0.5
- **Drop (t=4):** Decreases to 0.4
- **Final Value (t=5):** Maintains 0.4
---
## Observations
1. **ODE Strategy:**
- Exhibits the highest initial control value (0.7) but stabilizes at 0.4 after t=1.
- Shows minor fluctuation at t=4 (0.45) before returning to baseline.
2. **KOL-δ Strategy:**
- Maintains the lowest control value throughout (0.35–0.4).
- Demonstrates consistent stability after t=1.
3. **KOL-m Strategy:**
- Starts at the same value as ODE (0.7) but drops to 0.5 at t=1.
- Remains stable until t=4, where it aligns with other strategies at 0.4.
4. **Parameter Impact:**
- High `C_I` (1e4) and low `C_u` (1e-1) likely influence the control dynamics, as reflected in the step changes and stabilization patterns.
---
## Cross-Referenced Legend Accuracy
- **Blue (ODE):** Matches solid line with highest initial value.
- **Red (KOL-δ):** Matches dashed line with lowest values.
- **Purple (KOL-m):** Matches dash-dot line with intermediate values.
All legend labels and line styles are consistent with the chart data.