## Matrix Multiplication Diagram
### Overview
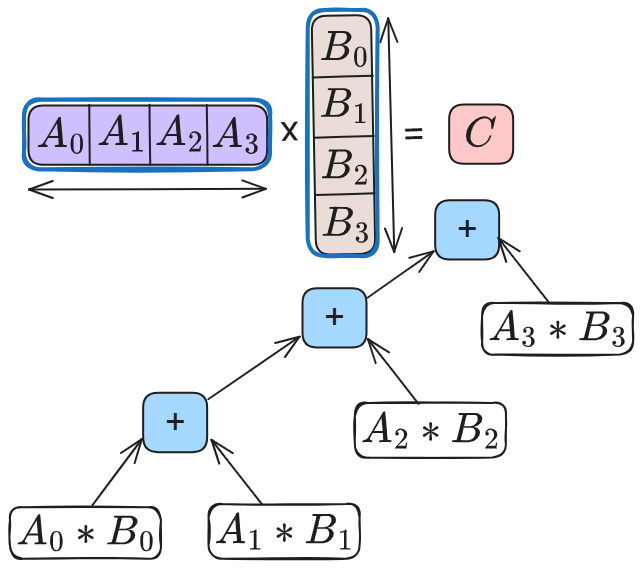
The image is a diagram illustrating the computation of a single element in the result of a matrix multiplication. It shows a row vector multiplied by a column vector, resulting in a scalar value. The diagram breaks down the multiplication and addition operations involved in calculating this scalar product using a tree-like structure.
### Components/Axes
* **Row Vector:** A horizontal array containing four elements: A0, A1, A2, A3. It is enclosed in a blue rounded rectangle with a double-headed arrow below it, indicating its length.
* **Column Vector:** A vertical array containing four elements: B0, B1, B2, B3. It is enclosed in a blue rounded rectangle with a double-headed arrow to the right of it, indicating its length.
* **Result:** A scalar value labeled "C", enclosed in a pink rounded rectangle.
* **Multiplication Symbol:** A "x" symbol between the row and column vectors.
* **Equals Symbol:** An "=" symbol between the column vector and the result "C".
* **Addition Nodes:** Blue rounded rectangles containing a "+" symbol. These represent addition operations.
* **Multiplication Nodes:** White rounded rectangles containing multiplication expressions (e.g., "A0 * B0"). These represent multiplication operations.
* **Arrows:** Arrows indicate the flow of data from the multiplication nodes to the addition nodes.
### Detailed Analysis or ### Content Details
The diagram illustrates the following calculation:
C = (A0 * B0) + (A1 * B1) + (A2 * B2) + (A3 * B3)
The calculation is broken down as follows:
1. **Bottom Level:**
* A0 is multiplied by B0, resulting in "A0 * B0".
* A1 is multiplied by B1, resulting in "A1 * B1".
2. **Middle Level:**
* A2 is multiplied by B2, resulting in "A2 * B2".
* A3 is multiplied by B3, resulting in "A3 * B3".
* "A0 * B0" and "A1 * B1" are added together.
3. **Top Level:**
* The result of ("A0 * B0" + "A1 * B1") is added to "A2 * B2".
* The result of that addition is added to "A3 * B3", resulting in the final value "C".
### Key Observations
* The diagram visually represents the dot product of two vectors.
* The tree structure shows the order of operations, with multiplications performed before additions.
* The diagram is a simplified representation of matrix multiplication, focusing on the calculation of a single element in the resulting matrix.
### Interpretation
The diagram effectively illustrates how a single element in the resulting matrix is computed during matrix multiplication. It breaks down the process into individual multiplication and addition operations, making it easier to understand the underlying calculations. The tree structure highlights the parallel nature of the multiplications and the sequential nature of the additions. This type of diagram is useful for explaining the concept of matrix multiplication to someone unfamiliar with the operation.