## Diagram: Dot Product Calculation
### Overview
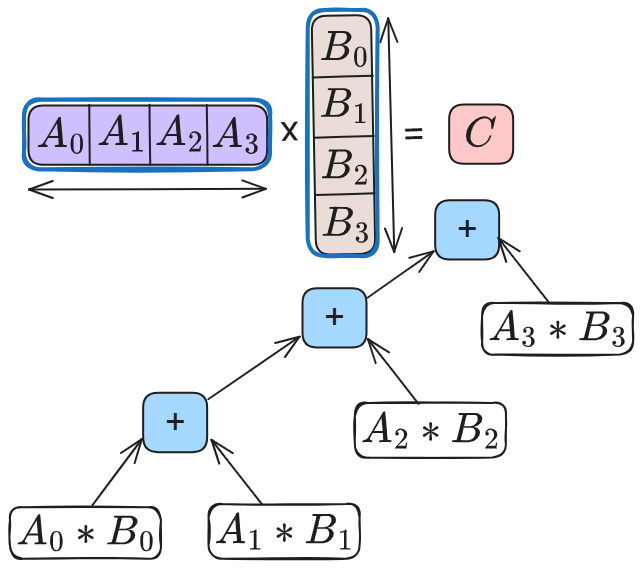
The image is a mathematical diagram illustrating the calculation of a dot product between two 4-element vectors, $A$ and $B$, resulting in a scalar $C$. The diagram is divided into two parts: a top section defining the vector operation and a bottom section detailing the sequential summation process used to compute the result.
### Components/Axes
* **Vector A (Top-Left):** A horizontal row vector containing four elements: $[A_0, A_1, A_2, A_3]$. The box is shaded purple.
* **Vector B (Top-Center):** A vertical column vector containing four elements: $[B_0, B_1, B_2, B_3]$. The box is shaded light red.
* **Result C (Top-Right):** A scalar value represented by the box labeled $C$. The box is shaded light red.
* **Operations:**
* **Multiplication ($*$):** Represented by the symbol "$*$" in white rounded rectangles.
* **Addition ($+$):** Represented by the symbol "$+$" in light blue rounded squares.
* **Arrows:** Indicate the flow of data from the individual products into the summation nodes.
### Detailed Analysis
The diagram breaks down the dot product $C = \sum_{i=0}^{3} A_i B_i$ into a sequential summation tree:
1. **Product Generation:**
* The diagram identifies four distinct product terms: $(A_0 * B_0)$, $(A_1 * B_1)$, $(A_2 * B_2)$, and $(A_3 * B_3)$. These are located at the bottom and right of the diagram.
2. **Summation Flow (Sequential Accumulation):**
* **First Addition (Bottom-Left):** The terms $(A_0 * B_0)$ and $(A_1 * B_1)$ flow into the lowest "+" node.
* **Second Addition (Middle):** The output of the first addition node flows into the middle "+" node, where it is added to $(A_2 * B_2)$.
* **Third Addition (Top-Right):** The output of the middle "+" node flows into the final, highest "+" node, where it is added to $(A_3 * B_3)$.
* **Final Result:** The output of the final "+" node represents the scalar $C$.
### Key Observations
* **Sequential vs. Parallel:** The diagram illustrates a sequential accumulation (a "linear" or "skewed" tree) rather than a balanced binary tree. This implies an order of operations where the sum is built up one term at a time.
* **Color Coding:**
* **Purple:** Associated with the row vector $A$.
* **Light Red:** Associated with the column vector $B$ and the final result $C$.
* **Light Blue:** Associated with the addition operations.
* **Layout:** The diagram uses a "staircase" layout for the addition nodes, visually reinforcing the sequential nature of the calculation.
### Interpretation
This diagram serves as a visual representation of the standard algorithm for computing a dot product, often implemented in software as a `for` loop or an accumulator variable.
By visualizing the operation as a sequential tree rather than a parallel reduction tree, the diagram highlights the dependency chain: the calculation of the final sum cannot be completed until the previous partial sums are computed. This is a fundamental concept in computer architecture and parallel computing; while this diagram shows a sequential approach, it implicitly contrasts with parallel reduction methods (where $A_0*B_0 + A_1*B_1$ and $A_2*B_2 + A_3*B_3$ could be computed simultaneously).