## Violin Plot: Reliance Sensitivity Comparison
### Overview
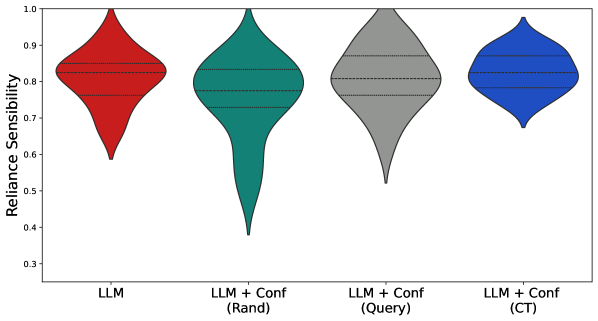
The image is a violin plot comparing the "Reliance Sensitivity" of different configurations. The x-axis represents different models or model configurations, while the y-axis represents the "Reliance Sensitivity" score, ranging from 0.3 to 1.0. Each violin plot shows the distribution of the "Reliance Sensitivity" for a given configuration.
### Components/Axes
* **Y-axis:** "Reliance Sensitivity", with a scale from 0.3 to 1.0, incrementing by 0.1.
* **X-axis:** Categorical axis representing different model configurations:
* LLM (Red)
* LLM + Conf (Rand) (Teal)
* LLM + Conf (Query) (Gray)
* LLM + Conf (CT) (Blue)
### Detailed Analysis
The violin plots show the distribution of "Reliance Sensitivity" for each configuration. Each violin plot contains three horizontal dashed lines, presumably representing quartiles or other statistical measures of the distribution.
* **LLM (Red):** The distribution is centered around 0.85, with a range from approximately 0.6 to 1.0.
* **LLM + Conf (Rand) (Teal):** The distribution is centered around 0.85, with a wider range from approximately 0.4 to 1.0.
* **LLM + Conf (Query) (Gray):** The distribution is centered around 0.85, with a range from approximately 0.5 to 1.0.
* **LLM + Conf (CT) (Blue):** The distribution is centered around 0.85, with a narrower range from approximately 0.7 to 1.0.
### Key Observations
* All configurations have a median "Reliance Sensitivity" around 0.85.
* "LLM + Conf (Rand)" has the widest distribution, indicating the most variability in "Reliance Sensitivity".
* "LLM + Conf (CT)" has the narrowest distribution, indicating the least variability in "Reliance Sensitivity".
### Interpretation
The violin plot suggests that adding confidence measures to the LLM model ("LLM + Conf") does not significantly change the median "Reliance Sensitivity". However, the method used to determine confidence ("Rand", "Query", "CT") affects the variability of the "Reliance Sensitivity". Using "CT" results in the most consistent "Reliance Sensitivity", while using "Rand" results in the most variable "Reliance Sensitivity". The "LLM" model alone has a similar median "Reliance Sensitivity" to the other configurations, but with a slightly narrower distribution than "LLM + Conf (Rand)" and "LLM + Conf (Query)".