\n
## Violin Plot: Reliance Sensibility Across Four Model Variants
### Overview
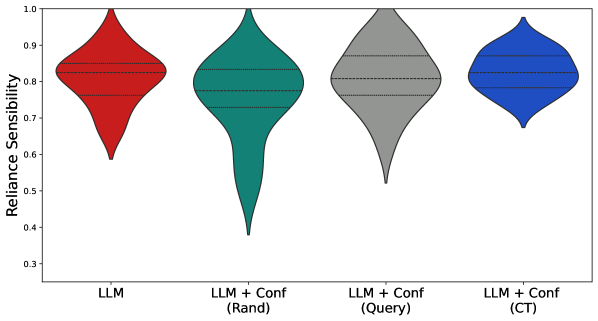
The image displays a violin plot comparing the distribution of a metric called "Reliance Sensibility" across four different model configurations. The plot visualizes the probability density of the data at different values, with wider sections indicating a higher frequency of data points.
### Components/Axes
* **Y-Axis:** Labeled "Reliance Sensibility". The scale runs from 0.3 to 1.0, with major tick marks at 0.3, 0.4, 0.5, 0.6, 0.7, 0.8, 0.9, and 1.0.
* **X-Axis:** Contains four categorical labels, each corresponding to a colored violin plot:
1. **LLM** (Red violin)
2. **LLM + Conf (Rand)** (Teal/Green violin)
3. **LLM + Conf (Query)** (Gray violin)
4. **LLM + Conf (CT)** (Blue violin)
* **Legend:** The x-axis labels serve as the legend, directly associating each model name with its corresponding color and plot.
### Detailed Analysis
Each violin plot shows the distribution shape, with internal horizontal lines indicating summary statistics. The solid central line represents the median, and the dashed lines above and below it represent the upper and lower quartiles (75th and 25th percentiles).
1. **LLM (Red, Leftmost):**
* **Shape:** Symmetrical, bulbous shape concentrated in the upper range.
* **Median:** Approximately 0.83.
* **Interquartile Range (IQR):** Roughly from 0.78 to 0.88.
* **Full Range:** Extends from approximately 0.60 to 1.0. The distribution tapers sharply below 0.7.
2. **LLM + Conf (Rand) (Teal, Second from Left):**
* **Shape:** Highly asymmetrical with a very long, thin tail extending downward.
* **Median:** Approximately 0.78.
* **IQR:** Roughly from 0.73 to 0.83.
* **Full Range:** The widest of all plots, extending from approximately 0.38 to 1.0. The bulk of the data is between 0.7 and 0.9, but a significant tail reaches much lower values.
3. **LLM + Conf (Query) (Gray, Third from Left):**
* **Shape:** Somewhat asymmetrical, with a tail extending downward but less severe than the "Rand" variant.
* **Median:** Approximately 0.81.
* **IQR:** Roughly from 0.76 to 0.85.
* **Full Range:** Extends from approximately 0.52 to 1.0.
4. **LLM + Conf (CT) (Blue, Rightmost):**
* **Shape:** The most compact and symmetrical distribution, concentrated tightly in the upper range.
* **Median:** Approximately 0.84 (the highest median).
* **IQR:** Roughly from 0.80 to 0.88.
* **Full Range:** The narrowest range, extending from approximately 0.68 to 1.0.
### Key Observations
* **Variability:** The "LLM + Conf (Rand)" model shows the highest variability and the lowest potential scores (long downward tail). The "LLM + Conf (CT)" model shows the lowest variability and most consistent high performance.
* **Central Tendency:** The median "Reliance Sensibility" is highest for "LLM + Conf (CT)" (~0.84), followed closely by the base "LLM" (~0.83). "LLM + Conf (Query)" is slightly lower (~0.81), and "LLM + Conf (Rand)" is the lowest (~0.78).
* **Distribution Shape:** All distributions are left-skewed (negatively skewed), meaning the tails extend toward lower values. This skew is most extreme for the "Rand" variant and least pronounced for the "CT" variant.
### Interpretation
The data suggests that adding a confidence mechanism ("Conf") to a base Large Language Model (LLM) has a nuanced effect on the "Reliance Sensibility" metric, which likely measures appropriate trust or calibration.
* The **base LLM** performs robustly with a high median and moderate spread.
* Adding a **random confidence method ("Rand")** introduces significant instability. While it can achieve high scores, it also produces many more instances of very low sensibility, dragging down the median and increasing risk.
* The **query-based confidence method ("Query")** offers a middle ground, slightly reducing the median compared to the base LLM but also reducing the extreme low-end outliers seen in the "Rand" method.
* The **"CT" confidence method** appears to be the most effective refinement. It yields the highest median sensibility and, crucially, the most consistent performance (narrowest distribution), effectively eliminating the very low scores seen in other variants. This implies that the "CT" method successfully calibrates or enhances the model's reliance in a reliable manner.
**In summary:** Not all confidence-enhancing methods are equal. While a poorly designed method ("Rand") can harm consistency, a well-designed one ("CT") can improve both the average performance and the reliability of the model's "Reliance Sensibility." The choice of confidence mechanism is critical.