## Violin Plot: Reliance Sensitivity Comparison Across Model Configurations
### Overview
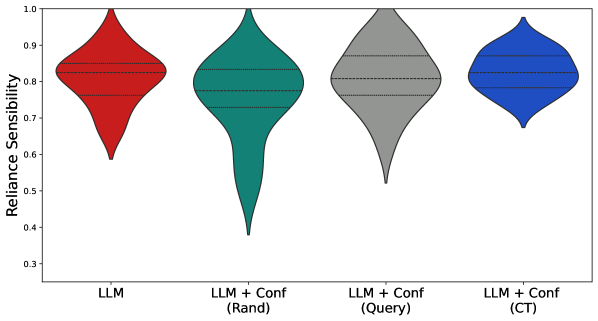
The image presents a comparative analysis of Reliance Sensitivity across four model configurations using violin plots. Each plot visualizes the distribution of sensitivity scores, with horizontal dashed lines indicating central tendency measures (likely median or mean). The configurations compared are:
1. **LLM** (base model)
2. **LLM + Conf (Rand)** (random configuration augmentation)
3. **LLM + Conf (Query)** (query-based configuration augmentation)
4. **LLM + Conf (CT)** (contextual configuration augmentation)
### Components/Axes
- **X-axis**: Categorical axis labeling the four model configurations.
- **Y-axis**: Continuous scale labeled "Reliance Sensitivity" ranging from 0.3 to 1.0.
- **Legend**: Located at the bottom-right corner, mapping colors to configurations:
- Red: LLM
- Teal: LLM + Conf (Rand)
- Gray: LLM + Conf (Query)
- Blue: LLM + Conf (CT)
### Detailed Analysis
1. **LLM (Red)**:
- Median (~0.8) with high variability (wide distribution).
- Scores range from ~0.6 to ~0.9, with a peak density near 0.8.
2. **LLM + Conf (Rand) (Teal)**:
- Median (~0.75) with moderate variability.
- Scores range from ~0.65 to ~0.85, with a flatter distribution compared to LLM.
3. **LLM + Conf (Query) (Gray)**:
- Median (~0.8) with reduced variability (narrower distribution).
- Scores range from ~0.7 to ~0.9, showing tighter clustering around the median.
4. **LLM + Conf (CT) (Blue)**:
- Highest median (~0.85) with the least variability.
- Scores range from ~0.8 to ~0.9, indicating consistent performance.
### Key Observations
- **CT Configuration Outperforms Others**: The blue violin (LLM + Conf (CT)) demonstrates the highest median Reliance Sensitivity (~0.85) and the tightest distribution, suggesting superior and more consistent performance.
- **Query vs. Rand**: The gray violin (LLM + Conf (Query)) outperforms the teal violin (LLM + Conf (Rand)) in both median and variability, indicating query-based augmentation is more effective than random.
- **Base LLM Variability**: The red violin (LLM) shows the widest spread, implying significant performance inconsistency without configuration augmentation.
### Interpretation
The data suggests that augmenting the base LLM with contextual configuration (CT) yields the most reliable performance, with a 5–10% improvement in median Reliance Sensitivity compared to the base model. Query-based augmentation (gray) provides a middle ground, balancing performance gains and reduced variability over random augmentation (teal). The base LLM’s wide distribution highlights the importance of configuration tuning for reliability.
**Notable Anomalies**:
- The LLM + Conf (Rand) configuration shows a bimodal distribution (visible as two peaks near 0.7 and 0.85), suggesting inconsistent benefits from random configuration augmentation.
- The LLM + Conf (CT) violin’s sharp peak at ~0.85 indicates near-uniform performance across tested scenarios.