\n
## Line Chart: Answer Accuracy vs. Layer for Llama Models
### Overview
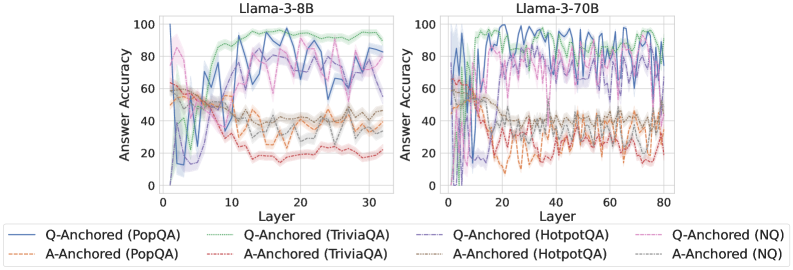
The image presents two line charts comparing the answer accuracy of two Llama models (Llama-3-8B and Llama-3-70B) across different layers. The x-axis represents the layer number, and the y-axis represents the answer accuracy, ranging from 0 to 100. Each chart displays multiple lines, each representing a different question-answering dataset and anchoring method.
### Components/Axes
* **X-axis:** Layer (ranging from 0 to 30 for Llama-3-8B and 0 to 80 for Llama-3-70B).
* **Y-axis:** Answer Accuracy (ranging from 0 to 100).
* **Left Chart Title:** Llama-3-8B
* **Right Chart Title:** Llama-3-70B
* **Legend:**
* Q-Anchored (PopQA) - Blue line
* A-Anchored (PopQA) - Light Brown/Orange dashed line
* Q-Anchored (TriviaQA) - Purple line
* A-Anchored (TriviaQA) - Green line
* Q-Anchored (HotpotQA) - Gray dashed line
* A-Anchored (HotpotQA) - Yellow/Beige line
* Q-Anchored (NQ) - Teal line
* A-Anchored (NQ) - Light Brown/Orange line
### Detailed Analysis or Content Details
**Llama-3-8B Chart (Left):**
* **Q-Anchored (PopQA):** The blue line starts at approximately 5% accuracy at layer 0, rises sharply to around 90% by layer 5, fluctuates between 70% and 95% for layers 5-25, and then declines to around 75% by layer 30.
* **A-Anchored (PopQA):** The light brown dashed line starts at approximately 60% accuracy at layer 0, decreases steadily to around 30% by layer 10, and remains relatively stable around 30-40% for the remaining layers.
* **Q-Anchored (TriviaQA):** The purple line starts at approximately 10% accuracy at layer 0, rises rapidly to around 95% by layer 5, and fluctuates between 80% and 95% for layers 5-30.
* **A-Anchored (TriviaQA):** The green line starts at approximately 20% accuracy at layer 0, rises to around 60% by layer 5, and remains relatively stable around 60-70% for the remaining layers.
* **Q-Anchored (HotpotQA):** The gray dashed line starts at approximately 5% accuracy at layer 0, rises to around 85% by layer 5, and fluctuates between 70% and 90% for layers 5-30.
* **A-Anchored (HotpotQA):** The yellow line starts at approximately 30% accuracy at layer 0, decreases to around 20% by layer 5, and remains relatively stable around 20-30% for the remaining layers.
* **Q-Anchored (NQ):** The teal line starts at approximately 10% accuracy at layer 0, rises to around 90% by layer 5, and fluctuates between 70% and 95% for layers 5-30.
* **A-Anchored (NQ):** The light brown line starts at approximately 40% accuracy at layer 0, decreases to around 30% by layer 5, and remains relatively stable around 30-40% for the remaining layers.
**Llama-3-70B Chart (Right):**
* **Q-Anchored (PopQA):** The blue line starts at approximately 5% accuracy at layer 0, rises sharply to around 90% by layer 5, fluctuates between 70% and 95% for layers 5-60, and then declines to around 75% by layer 80.
* **A-Anchored (PopQA):** The light brown dashed line starts at approximately 60% accuracy at layer 0, decreases steadily to around 30% by layer 10, and remains relatively stable around 30-40% for the remaining layers.
* **Q-Anchored (TriviaQA):** The purple line starts at approximately 10% accuracy at layer 0, rises rapidly to around 95% by layer 5, and fluctuates between 80% and 95% for layers 5-80.
* **A-Anchored (TriviaQA):** The green line starts at approximately 20% accuracy at layer 0, rises to around 60% by layer 5, and remains relatively stable around 60-70% for the remaining layers.
* **Q-Anchored (HotpotQA):** The gray dashed line starts at approximately 5% accuracy at layer 0, rises to around 85% by layer 5, and fluctuates between 70% and 90% for layers 5-80.
* **A-Anchored (HotpotQA):** The yellow line starts at approximately 30% accuracy at layer 0, decreases to around 20% by layer 5, and remains relatively stable around 20-30% for the remaining layers.
* **Q-Anchored (NQ):** The teal line starts at approximately 10% accuracy at layer 0, rises to around 90% by layer 5, and fluctuates between 70% and 95% for layers 5-80.
* **A-Anchored (NQ):** The light brown line starts at approximately 40% accuracy at layer 0, decreases to around 30% by layer 5, and remains relatively stable around 30-40% for the remaining layers.
### Key Observations
* For both models, the "Q-Anchored" lines consistently exhibit higher accuracy than the "A-Anchored" lines across all datasets.
* The accuracy of the "Q-Anchored" lines generally peaks around layer 5 and remains relatively high for subsequent layers.
* The "A-Anchored" lines show a decreasing trend in accuracy after layer 0, stabilizing at a lower level.
* The Llama-3-70B model shows a more extended period of high accuracy compared to the Llama-3-8B model, as evidenced by the longer x-axis range.
* The datasets (PopQA, TriviaQA, HotpotQA, NQ) show similar accuracy trends for both anchoring methods within each model.
### Interpretation
The data suggests that question-anchored prompting consistently outperforms answer-anchored prompting for both Llama-3-8B and Llama-3-70B models across various question-answering datasets. This indicates that providing the question as context during the model's processing leads to more accurate answers. The initial rise in accuracy followed by stabilization or slight decline suggests that the models learn effectively up to a certain layer, after which further layers may not contribute significantly to performance or could even introduce noise. The larger model (Llama-3-70B) demonstrates a more sustained high accuracy, indicating its greater capacity to retain and utilize learned information across deeper layers. The consistent performance differences between datasets suggest that the difficulty and characteristics of each dataset influence the overall accuracy, but the relative performance of anchoring methods remains consistent. The A-Anchored lines consistently underperform, suggesting that the answer context is less useful for the model than the question context. This could be due to the way the models are trained or the nature of the question-answering task.