## Line Charts: Answer Accuracy Across Layers for Llama-3 Models
### Overview
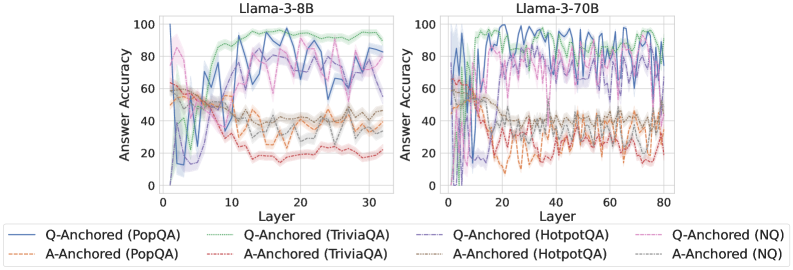
The image contains two side-by-side line charts comparing the "Answer Accuracy" of different question-answering (QA) datasets across the layers of two large language models: Llama-3-8B (left chart) and Llama-3-70B (right chart). The charts evaluate two distinct methods, "Q-Anchored" and "A-Anchored," across four datasets: PopQA, TriviaQA, HotpotQA, and NQ.
### Components/Axes
* **Chart Titles:** "Llama-3-8B" (left), "Llama-3-70B" (right).
* **Y-Axis (Both Charts):** Label: "Answer Accuracy". Scale: 0 to 100, with major ticks at intervals of 20 (0, 20, 40, 60, 80, 100).
* **X-Axis (Left Chart - Llama-3-8B):** Label: "Layer". Scale: 0 to 30, with major ticks at 0, 10, 20, 30.
* **X-Axis (Right Chart - Llama-3-70B):** Label: "Layer". Scale: 0 to 80, with major ticks at 0, 20, 40, 60, 80.
* **Legend (Bottom, spanning both charts):** Contains 8 entries, differentiating lines by color and style (solid vs. dashed).
* **Q-Anchored (Solid Lines):**
* Blue: Q-Anchored (PopQA)
* Green: Q-Anchored (TriviaQA)
* Purple: Q-Anchored (HotpotQA)
* Pink: Q-Anchored (NQ)
* **A-Anchored (Dashed Lines):**
* Orange: A-Anchored (PopQA)
* Red: A-Anchored (TriviaQA)
* Brown: A-Anchored (HotpotQA)
* Gray: A-Anchored (NQ)
### Detailed Analysis
**Llama-3-8B Chart (Left):**
* **Q-Anchored (Solid Lines):** All four solid lines show a general trend of increasing accuracy from layer 0, peaking in the middle-to-late layers (approximately layers 10-25), and then slightly declining or stabilizing towards layer 30.
* **Q-Anchored (TriviaQA - Green):** Appears to be the top performer, reaching near 100% accuracy around layer 15 and maintaining high accuracy (>80%) thereafter.
* **Q-Anchored (HotpotQA - Purple):** Shows high volatility but generally high accuracy, peaking around 90% in the mid-layers.
* **Q-Anchored (PopQA - Blue) & (NQ - Pink):** Follow similar trajectories, peaking between 70-90% accuracy in the mid-layers.
* **A-Anchored (Dashed Lines):** All four dashed lines exhibit significantly lower accuracy compared to their Q-Anchored counterparts. They start around 40-60% accuracy at layer 0, show a general downward trend with high volatility, and mostly settle between 20-40% accuracy in the later layers.
* **A-Anchored (TriviaQA - Red):** Shows the most pronounced decline, dropping to near 20% accuracy by layer 30.
* The other A-Anchored lines (PopQA - Orange, HotpotQA - Brown, NQ - Gray) cluster together in the 30-40% range in the final layers.
**Llama-3-70B Chart (Right):**
* **Q-Anchored (Solid Lines):** The pattern is similar to the 8B model but extended over more layers. Accuracy rises sharply in the first ~10 layers, reaches a high plateau (often between 80-100%) from layers ~15 to ~60, and shows a slight decline or increased volatility in the final 20 layers.
* **Q-Anchored (TriviaQA - Green) & (HotpotQA - Purple):** Consistently perform at the top, frequently touching or exceeding 90% accuracy through the middle layers.
* **Q-Anchored (PopQA - Blue) & (NQ - Pink):** Also perform strongly, generally staying above 70% accuracy in the stable middle region.
* **A-Anchored (Dashed Lines):** As with the 8B model, these lines perform markedly worse. They start between 40-60%, exhibit a downward trend with significant noise, and converge into a band between approximately 20-40% accuracy from layer 40 onward.
* The four A-Anchored lines are tightly clustered and difficult to distinguish in the later layers, all showing similar low-accuracy, high-volatility behavior.
### Key Observations
1. **Method Dominance:** There is a stark and consistent performance gap between the Q-Anchored (solid lines) and A-Anchored (dashed lines) methods across both models and all four datasets. Q-Anchored is vastly superior.
2. **Layer-wise Trend:** For the effective Q-Anchored method, accuracy follows an inverted-U or plateau shape: low in very early layers, high in middle layers, and slightly declining in the final layers.
3. **Model Scale:** The larger Llama-3-70B model maintains high accuracy for a longer span of layers (a wider plateau) compared to the 8B model, suggesting more robust internal processing across its depth.
4. **Dataset Variation:** Among the Q-Anchored results, TriviaQA (green) and HotpotQA (purple) often achieve the highest peak accuracies, while PopQA and NQ are slightly lower but follow the same pattern.
5. **A-Anchored Instability:** The A-Anchored method not only yields lower accuracy but also shows high volatility (jagged lines), indicating unstable performance across layers.
### Interpretation
This data strongly suggests that the **"Q-Anchored" approach is fundamentally more effective** for extracting accurate answers from these Llama-3 models than the "A-Anchored" approach. The Q-Anchored method likely leverages the model's internal representations in a way that aligns better with its knowledge retrieval and reasoning processes, particularly in the middle layers which are often associated with higher-level semantic processing.
The **decline in accuracy in the final layers** for the Q-Anchored method is a notable finding. It could indicate that the very last layers are specialized for tasks other than direct answer generation (e.g., output formatting, safety filtering) or that the signal becomes nozier. The **superior and more stable performance of the 70B model** demonstrates the benefit of scale, not just in peak accuracy but in maintaining that accuracy across a broader section of the network.
The **poor and unstable performance of the A-Anchored method** serves as a critical control, highlighting that not all probing or anchoring techniques are equal. Its failure across all datasets and models points to a methodological flaw in how it interfaces with the model's knowledge. For technical document purposes, this chart provides clear empirical evidence to guide the selection of methodologies when working with Llama-3 models for question-answering tasks.