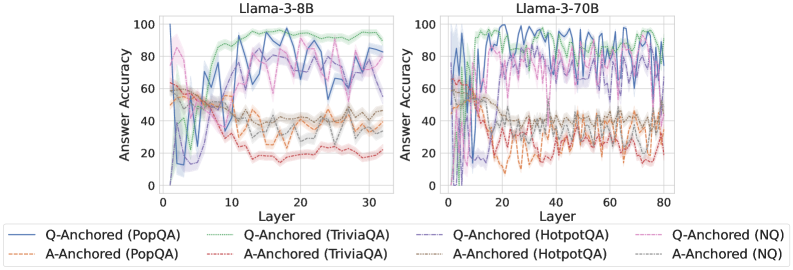
## Line Graph: Answer Accuracy Across Layers for Llama-3-8B and Llama-3-70B Models
### Overview
The image contains two side-by-side line graphs comparing answer accuracy across layers of the Llama-3-8B and Llama-3-70B models. Each graph displays multiple data series representing different anchoring methods (Q-Anchored and A-Anchored) and datasets (PopQA, TriviaQA, HotpotQA, NQ). The y-axis measures answer accuracy (%), while the x-axis represents model layers. The graphs highlight variability in performance across layers and datasets.
---
### Components/Axes
- **Y-Axis**: "Answer Accuracy (%)" with a scale from 0 to 100.
- **X-Axis**: "Layer" with scales:
- Left panel (Llama-3-8B): 0 to 30.
- Right panel (Llama-3-70B): 0 to 80.
- **Legend**: Located at the bottom, with eight entries:
1. **Q-Anchored (PopQA)**: Solid blue line.
2. **A-Anchored (PopQA)**: Dashed orange line.
3. **Q-Anchored (TriviaQA)**: Solid green line.
4. **A-Anchored (TriviaQA)**: Dashed gray line.
5. **Q-Anchored (HotpotQA)**: Solid purple line.
6. **A-Anchored (HotpotQA)**: Dashed red line.
7. **Q-Anchored (NQ)**: Solid pink line.
8. **A-Anchored (NQ)**: Dashed black line.
---
### Detailed Analysis
#### Llama-3-8B (Left Panel)
- **Q-Anchored (PopQA)**: Starts at ~85% accuracy, dips to ~60% by layer 10, then stabilizes around ~70%.
- **A-Anchored (PopQA)**: Begins at ~60%, fluctuates between ~40% and ~70%, ending near ~50%.
- **Q-Anchored (TriviaQA)**: Peaks at ~90% in early layers, drops to ~70% by layer 20, then stabilizes.
- **A-Anchored (TriviaQA)**: Starts at ~70%, declines to ~50% by layer 20, then fluctuates.
- **Q-Anchored (HotpotQA)**: Starts at ~80%, dips to ~60% by layer 10, then rises to ~75%.
- **A-Anchored (HotpotQA)**: Begins at ~60%, fluctuates between ~40% and ~70%, ending near ~55%.
- **Q-Anchored (NQ)**: Starts at ~90%, drops to ~70% by layer 10, then stabilizes.
- **A-Anchored (NQ)**: Begins at ~70%, declines to ~50% by layer 10, then fluctuates.
#### Llama-3-70B (Right Panel)
- **Q-Anchored (PopQA)**: Starts at ~90%, dips to ~70% by layer 20, then stabilizes around ~80%.
- **A-Anchored (PopQA)**: Begins at ~70%, fluctuates between ~50% and ~80%, ending near ~65%.
- **Q-Anchored (TriviaQA)**: Peaks at ~95% in early layers, drops to ~80% by layer 40, then stabilizes.
- **A-Anchored (TriviaQA)**: Starts at ~80%, declines to ~60% by layer 40, then fluctuates.
- **Q-Anchored (HotpotQA)**: Starts at ~85%, dips to ~70% by layer 40, then rises to ~85%.
- **A-Anchored (HotpotQA)**: Begins at ~70%, fluctuates between ~50% and ~80%, ending near ~65%.
- **Q-Anchored (NQ)**: Starts at ~95%, drops to ~80% by layer 40, then stabilizes.
- **A-Anchored (NQ)**: Begins at ~80%, declines to ~60% by layer 40, then fluctuates.
---
### Key Observations
1. **Model Size Impact**: Llama-3-70B generally shows higher baseline accuracy than Llama-3-8B, but both exhibit significant layer-to-layer variability.
2. **Anchoring Method**: Q-Anchored methods consistently outperform A-Anchored across datasets, though performance gaps narrow in later layers.
3. **Dataset Variability**:
- **PopQA** and **TriviaQA** show the most pronounced accuracy drops in early layers.
- **HotpotQA** and **NQ** exhibit more stable trends but still experience fluctuations.
4. **Layer-Specific Trends**:
- Early layers (0–10) often show higher accuracy, followed by a decline or stabilization.
- Later layers (20–30/80) display increased variability, suggesting potential overfitting or model complexity issues.
---
### Interpretation
The data suggests that **Q-Anchored methods** (e.g., PopQA, TriviaQA) generally yield higher answer accuracy than A-Anchored methods, particularly in early layers. However, the **Llama-3-70B model** demonstrates greater overall stability and higher baseline performance compared to the 8B variant, though its accuracy still fluctuates significantly across layers.
The **dataset-specific trends** indicate that some datasets (e.g., PopQA, TriviaQA) are more sensitive to layer depth, while others (e.g., HotpotQA, NQ) show more consistent performance. The **Q-Anchored approach** appears to mitigate accuracy drops in later layers, possibly due to better alignment with query structures.
Notably, the **A-Anchored methods** (e.g., A-Anchored PopQA) exhibit the most erratic trends, suggesting that anchoring to answers (A-Anchored) may introduce instability compared to query-based anchoring (Q-Anchored). This could imply that query-focused anchoring strategies are more robust for maintaining accuracy across model layers.
The **model size** (8B vs. 70B) does not guarantee consistent performance improvements, as the 70B model still shows layer-specific variability. This highlights the importance of architectural and methodological choices (e.g., anchoring) over sheer model size alone.