## Scatter Plot: Data Distribution in Two Dimensions
### Overview
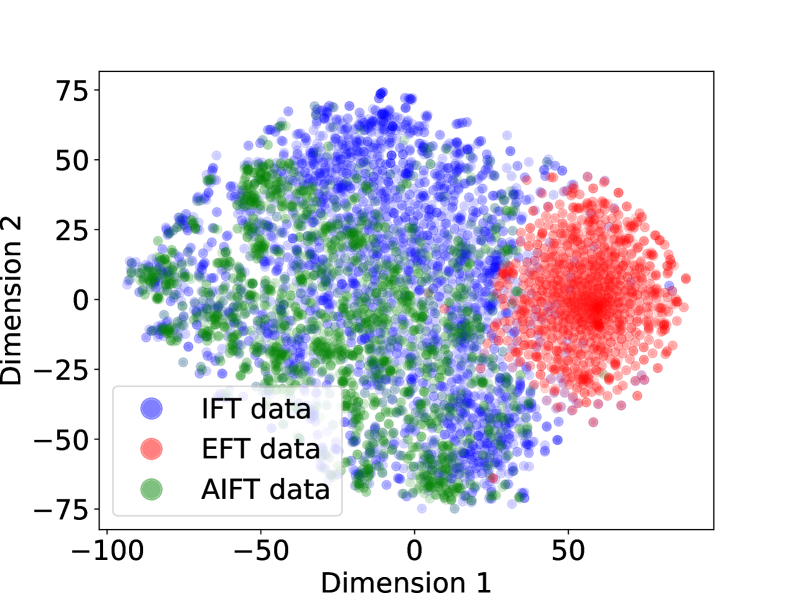
The image is a scatter plot visualizing the distribution of three datasets (IFT, EFT, and AIFT) across two dimensions. Each data point is represented by a colored circle, with blue for IFT data, red for EFT data, and green for AIFT data. The plot shows the clustering and overlap of these datasets in a two-dimensional space.
### Components/Axes
* **X-axis:** Dimension 1, ranging from -100 to 50. Axis markers are present at -100, -50, 0, and 50.
* **Y-axis:** Dimension 2, ranging from -75 to 75. Axis markers are present at -75, -50, -25, 0, 25, 50, and 75.
* **Legend:** Located in the bottom-left corner, it identifies the color-coded datasets:
* Blue: IFT data
* Red: EFT data
* Green: AIFT data
### Detailed Analysis
* **IFT data (Blue):** The blue data points are concentrated in the top-left quadrant, with a spread from approximately x = -75 to 25 and y = 0 to 75.
* **EFT data (Red):** The red data points are clustered in the top-right quadrant, with a spread from approximately x = 25 to 75 and y = -25 to 50.
* **AIFT data (Green):** The green data points are primarily located in the bottom-left quadrant, with a spread from approximately x = -75 to 25 and y = -75 to 25. There is some overlap with the IFT data.
### Key Observations
* The three datasets exhibit distinct clustering patterns in the two-dimensional space.
* There is some overlap between the IFT and AIFT datasets, particularly in the region where both are present.
* The EFT dataset appears to be the most spatially separated from the other two.
### Interpretation
The scatter plot suggests that the IFT, EFT, and AIFT datasets have different characteristics that can be visualized in a two-dimensional space. The clustering patterns indicate that these datasets may represent different categories or classes. The overlap between IFT and AIFT data suggests some similarity or correlation between these two datasets, while EFT data is more distinct. This visualization could be used for exploratory data analysis, feature selection, or classification tasks.