# Technical Document Extraction: Scatter Plot Analysis
## Axes and Labels
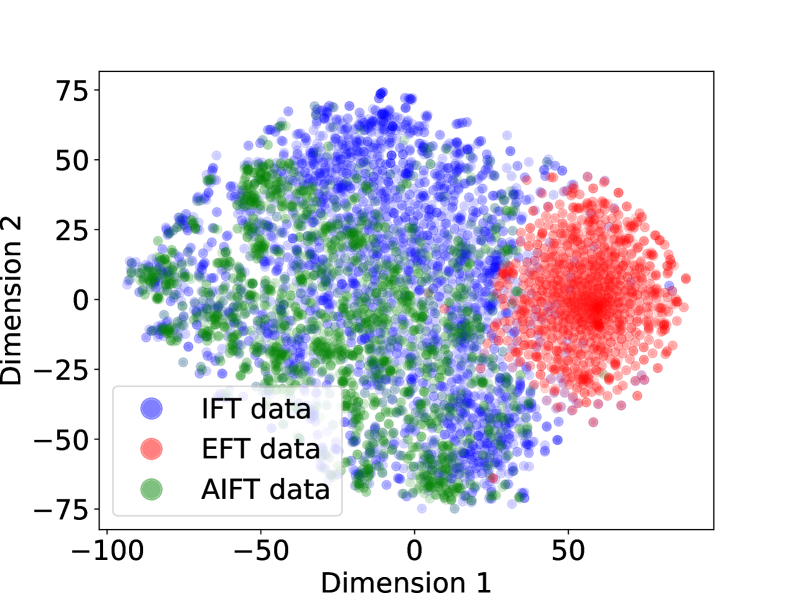
- **X-axis**: Labeled "Dimension 1", ranging from **-100** to **50**.
- **Y-axis**: Labeled "Dimension 2", ranging from **-75** to **75**.
## Legend
- **Blue dots**: Represent **IFT data**.
- **Red dots**: Represent **EFT data**.
- **Green dots**: Represent **AIFT data**.
## Data Distribution
1. **EFT Data (Red)**:
- Clustered densely in the **top-right quadrant** (positive Dimension 1 and Dimension 2).
- Forms a distinct, tightly packed group with minimal overlap with other datasets.
2. **IFT Data (Blue)**:
- Distributed across the **left and central regions** of the plot.
- Overlaps with AIFT data but shows a slight concentration in the **lower-left quadrant** (negative Dimension 1, negative Dimension 2).
3. **AIFT Data (Green)**:
- Spread across the **central and upper regions** of the plot.
- Overlaps significantly with IFT data but exhibits a broader distribution compared to EFT.
## Key Observations
- **EFT data** is spatially distinct from IFT and AIFT, suggesting a unique characteristic or grouping.
- **IFT and AIFT data** exhibit partial overlap, indicating potential shared features or transitional states.
- No explicit numerical data table is present; analysis relies on spatial clustering and legend labels.
## Cross-Reference Validation
- Legend colors (blue, red, green) are consistently mapped to their respective datasets (IFT, EFT, AIFT) across the plot.
- Axis ranges and labels are explicitly defined, ensuring clarity in spatial interpretation.