## Scatter Plot with Regression Lines: Reasoning Chain Length vs. Human Accuracy by Sentence Type
### Overview
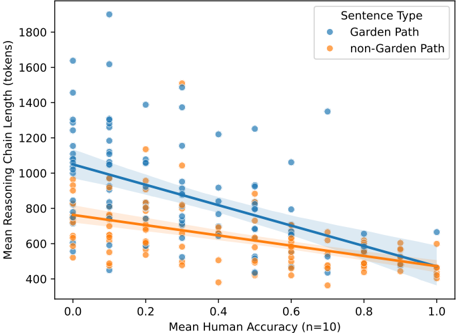
This image is a scatter plot with overlaid linear regression trend lines. It visualizes the relationship between the mean human accuracy on a task (x-axis) and the mean length of the reasoning chain generated by a model (y-axis, in tokens). The data is split into two categories based on sentence type: "Garden Path" and "non-Garden Path."
### Components/Axes
* **Chart Type:** Scatter plot with linear regression lines and confidence intervals (shaded bands).
* **X-Axis:**
* **Label:** `Mean Human Accuracy (n=10)`
* **Scale:** Linear, ranging from 0.0 to 1.0, with major tick marks at 0.0, 0.2, 0.4, 0.6, 0.8, and 1.0.
* **Y-Axis:**
* **Label:** `Mean Reasoning Chain Length (tokens)`
* **Scale:** Linear, ranging from 400 to 1800, with major tick marks at 400, 600, 800, 1000, 1200, 1400, 1600, and 1800.
* **Legend:**
* **Title:** `Sentence Type`
* **Position:** Top-right corner of the plot area.
* **Categories:**
1. `Garden Path` - Represented by blue circles and a blue trend line.
2. `non-Garden Path` - Represented by orange circles and an orange trend line.
### Detailed Analysis
**Data Series & Trends:**
1. **Garden Path (Blue):**
* **Visual Trend:** The blue data points show a clear negative correlation. The blue regression line slopes downward from left to right.
* **Estimated Trend Line Points:**
* At x=0.0, y ≈ 1050 tokens.
* At x=1.0, y ≈ 500 tokens.
* **Data Spread:** The blue points are widely scattered, especially at lower accuracy values (x < 0.4). There are several high outliers, with some points exceeding 1600 tokens at x ≈ 0.1 and one point near 1900 tokens at x ≈ 0.1. The spread (variance) appears to decrease as human accuracy increases.
2. **non-Garden Path (Orange):**
* **Visual Trend:** The orange data points also show a negative correlation, but the slope of the orange regression line is less steep than the blue line.
* **Estimated Trend Line Points:**
* At x=0.0, y ≈ 750 tokens.
* At x=1.0, y ≈ 450 tokens.
* **Data Spread:** The orange points are more tightly clustered around their trend line compared to the blue points. The variance appears more consistent across the x-axis range. The highest orange points are around 1500 tokens at x ≈ 0.3.
**Relationship Between Series:**
* For any given level of mean human accuracy, the mean reasoning chain length for **Garden Path** sentences is consistently **higher** than for **non-Garden Path** sentences.
* The gap between the two trend lines is largest at low human accuracy (x=0.0, difference ≈ 300 tokens) and narrows as accuracy increases (at x=1.0, difference ≈ 50 tokens).
* The confidence intervals (shaded areas) for the two lines do not appear to overlap significantly across most of the range, suggesting the difference in chain length between the two sentence types is statistically meaningful.
### Key Observations
1. **Negative Correlation:** There is a clear inverse relationship for both sentence types: as human accuracy on a task increases, the model's average reasoning chain length decreases.
2. **Greater Complexity for Garden Path Sentences:** Garden Path sentences are associated with significantly longer reasoning chains, particularly when humans find them difficult (low accuracy). This suggests the model engages in more extensive processing for these linguistically complex structures.
3. **Convergence at High Accuracy:** At perfect human accuracy (x=1.0), the reasoning chain lengths for both sentence types are much closer (≈500 vs. ≈450 tokens), indicating that when a problem is unambiguous to humans, the model's processing effort is similar regardless of sentence type.
4. **Higher Variance for Garden Path:** The wide scatter of blue points indicates high variability in the model's reasoning chain length for Garden Path sentences, especially at low accuracy. This suggests the model's response to these sentences is less consistent.
### Interpretation
This chart demonstrates a core finding about model behavior in relation to linguistic complexity and human-perceived difficulty.
* **What the data suggests:** The model allocates more computational resources (longer reasoning chains) to process sentences that are known to be temporarily ambiguous or misleading (Garden Path sentences). This "effort" is most pronounced when the sentences are also difficult for humans to parse correctly (low accuracy). The negative slope implies that as a task becomes easier for humans (higher accuracy), the model can arrive at an answer more efficiently (shorter chains).
* **How elements relate:** The x-axis (human accuracy) serves as a proxy for task difficulty or clarity. The y-axis (chain length) is a proxy for model processing effort. The two series (sentence types) show that linguistic structure is a key moderating variable. The steeper slope for Garden Path sentences indicates that their processing efficiency improves more dramatically with increasing task clarity compared to standard sentences.
* **Notable implications:** The high variance for Garden Path sentences at low accuracy is particularly interesting. It suggests that when faced with a difficult, ambiguous sentence, the model's reasoning process is unstable—it might generate a very long, exploratory chain or a shorter, perhaps incorrect, one. This variability could be a target for improving model robustness. The convergence at high accuracy provides a baseline: for clear, unambiguous input, the model's processing length is relatively fixed and similar across structures.