## Scatter Plot: Mean Reasoning Chain Length vs. Mean Human Accuracy
### Overview
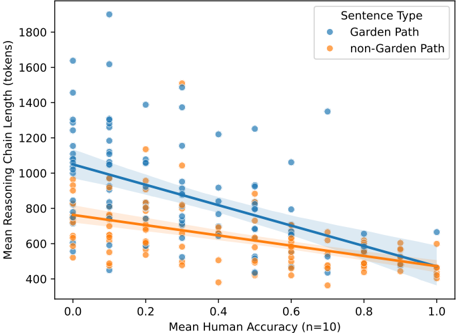
The image is a scatter plot comparing **Mean Reasoning Chain Length (tokens)** (y-axis) against **Mean Human Accuracy (n=10)** (x-axis). Two data series are represented:
- **Garden Path** (blue dots and line)
- **non-Garden Path** (orange dots and line)
Both series show a downward trend, with shaded regions indicating confidence intervals.
---
### Components/Axes
- **X-axis**:
- Label: "Mean Human Accuracy (n=10)"
- Scale: 0.0 to 1.0 in increments of 0.2
- Position: Bottom of the plot
- **Y-axis**:
- Label: "Mean Reasoning Chain Length (tokens)"
- Scale: 400 to 1800 in increments of 200
- Position: Left side of the plot
- **Legend**:
- Located in the **top-right corner**
- Labels:
- **Garden Path** (blue)
- **non-Garden Path** (orange)
- **Lines**:
- **Garden Path**: Blue line with shaded confidence interval (light blue)
- **non-Garden Path**: Orange line with shaded confidence interval (light orange)
---
### Detailed Analysis
1. **Garden Path (Blue)**:
- Data points cluster **higher on the y-axis** (longer chains) at lower x-values (lower accuracy).
- At x=0.0, mean chain length ≈ **1000 tokens** (range: 800–1200).
- At x=1.0, mean chain length ≈ **400 tokens** (range: 300–500).
- Trend: Steeper decline compared to non-Garden Path.
2. **non-Garden Path (Orange)**:
- Data points cluster **lower on the y-axis** (shorter chains) across all x-values.
- At x=0.0, mean chain length ≈ **800 tokens** (range: 600–1000).
- At x=1.0, mean chain length ≈ **400 tokens** (range: 300–500).
- Trend: Gradual decline, less steep than Garden Path.
3. **Confidence Intervals**:
- Both lines have shaded regions (±1 standard deviation).
- Garden Path shows **greater variability** (wider shaded area) at lower accuracies.
---
### Key Observations
- **Convergence at x=1.0**: Both series converge to ~400 tokens at maximum accuracy (x=1.0).
- **Divergence at x=0.0**: Garden Path starts ~200 tokens higher than non-Garden Path.
- **Variability**: Garden Path exhibits higher uncertainty (wider shaded regions) at lower accuracies.
---
### Interpretation
1. **Relationship Between Accuracy and Chain Length**:
- As human accuracy increases, reasoning chain length decreases for both sentence types. This suggests that higher accuracy correlates with more efficient reasoning.
2. **Garden Path vs. non-Garden Path**:
- **Garden Path** sentences (blue) require **longer initial chains** but show **greater efficiency gains** as accuracy improves. This may reflect their syntactic complexity, which demands more tokens to process but becomes streamlined with higher accuracy.
- **non-Garden Path** sentences (orange) maintain **shorter, more consistent chains**, indicating simpler structures with less variability in reasoning demands.
3. **Anomalies**:
- A few Garden Path data points at x=0.8–1.0 exceed 600 tokens, suggesting outliers where high accuracy coexists with longer chains.
- non-Garden Path points at x=0.0–0.2 show unexpected spikes up to 1000 tokens, possibly indicating edge cases or measurement noise.
4. **Practical Implications**:
- Garden Path sentences may benefit from targeted optimization to reduce initial chain length without sacrificing accuracy.
- non-Garden Path sentences are already efficient but could be further refined for consistency.
---
**Note**: All values are approximate, with uncertainty reflected in shaded regions. The plot uses English labels exclusively.