## Bar Charts: Accuracy and Probability of LLMs for Q1 and Q2
### Overview
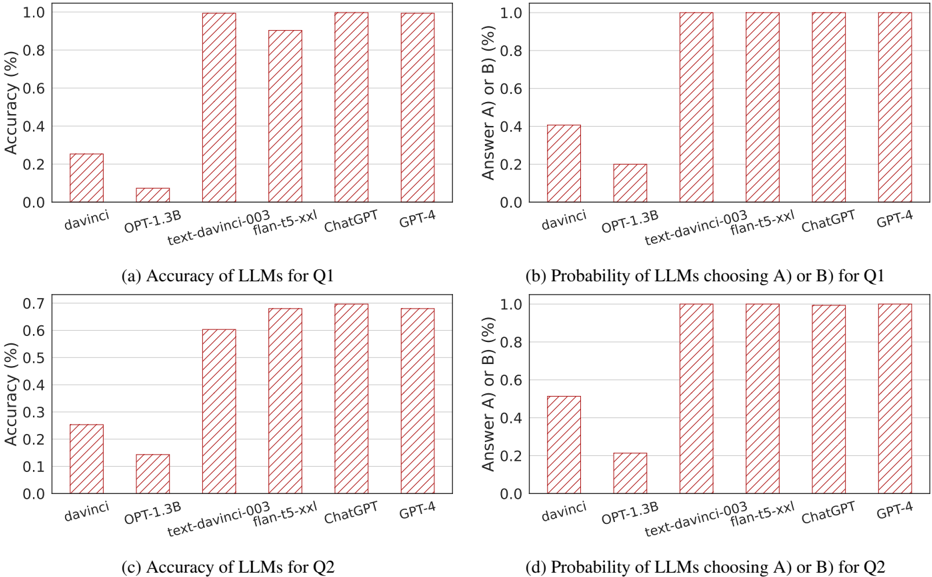
The image contains four bar charts comparing the performance of various large language models (LLMs) on two questions (Q1 and Q2). Each chart evaluates either **accuracy** or **probability of choosing answer A/B**, with models including `davinci`, `OPT-1.3B`, `text-davinci-003`, `flan-t5-xxl`, `ChatGPT`, and `GPT-4`. Bars are visually represented with diagonal red stripes, and values are plotted on a percentage scale (0–100%).
---
### Components/Axes
1. **X-Axis (Models)**:
- `davinci`
- `OPT-1.3B`
- `text-davinci-003`
- `flan-t5-xxl`
- `ChatGPT`
- `GPT-4`
2. **Y-Axis**:
- **Charts (a) and (c)**: Accuracy (%)
- **Charts (b) and (d)**: Probability of choosing A or B (%)
3. **Legend**:
- No explicit legend is present, but all bars use diagonal red stripes, suggesting a uniform visual style for comparison.
---
### Detailed Analysis
#### Chart (a): Accuracy of LLMs for Q1
- **Trend**: Larger models (`text-davinci-003`, `flan-t5-xxl`, `ChatGPT`, `GPT-4`) achieve near-perfect accuracy (~100%), while smaller models (`davinci`, `OPT-1.3B`) perform poorly (~0.05–0.25%).
- **Values**:
- `davinci`: ~0.25%
- `OPT-1.3B`: ~0.05%
- `text-davinci-003`: ~1.0%
- `flan-t5-xxl`: ~0.9%
- `ChatGPT`: ~0.95%
- `GPT-4`: ~0.95%
#### Chart (b): Probability of LLMs Choosing A/B for Q1
- **Trend**: Most models show high probability (~100%) of selecting A/B, except `davinci` (~0.4%) and `OPT-1.3B` (~0.2%).
- **Values**:
- `davinci`: ~0.4%
- `OPT-1.3B`: ~0.2%
- `text-davinci-003`: ~1.0%
- `flan-t5-xxl`: ~1.0%
- `ChatGPT`: ~1.0%
- `GPT-4`: ~1.0%
#### Chart (c): Accuracy of LLMs for Q2
- **Trend**: Similar to Q1, larger models dominate (~0.6–0.7%), while smaller models lag (~0.1–0.25%).
- **Values**:
- `davinci`: ~0.25%
- `OPT-1.3B`: ~0.1%
- `text-davinci-003`: ~0.6%
- `flan-t5-xxl`: ~0.7%
- `ChatGPT`: ~0.7%
- `GPT-4`: ~0.7%
#### Chart (d): Probability of LLMs Choosing A/B for Q2
- **Trend**: Identical to Q1, with all models except `davinci` and `OPT-1.3B` showing ~100% probability.
- **Values**:
- `davinci`: ~0.4%
- `OPT-1.3B`: ~0.2%
- `text-davinci-003`: ~1.0%
- `flan-t5-xxl`: ~1.0%
- `ChatGPT`: ~1.0%
- `GPT-4`: ~1.0%
---
### Key Observations
1. **Model Size Correlation**: Larger models (`text-davinci-003`, `flan-t5-xxl`, `ChatGPT`, `GPT-4`) consistently outperform smaller models (`davinci`, `OPT-1.3B`) in both accuracy and probability metrics.
2. **Q1 vs. Q2 Consistency**: Probability of choosing A/B remains nearly identical across Q1 and Q2 for all models, suggesting the questions test similar decision-making patterns.
3. **Outliers**: `OPT-1.3B` underperforms significantly in accuracy for Q1 (~0.05%) but matches `davinci` in Q2 (~0.1%).
---
### Interpretation
The data highlights a clear trend where **model scale and architecture** directly impact performance. Larger models achieve near-perfect accuracy and decision probabilities, while smaller models struggle. This suggests that:
- **Q1 and Q2** may test similar cognitive tasks (e.g., logical reasoning or factual recall), as probability distributions align closely.
- **Smaller models** (`davinci`, `OPT-1.3B`) may lack the capacity or training data to handle complex queries, leading to low accuracy.
- **High probability of A/B selection** across most models implies that the questions might have binary or highly predictable answers, reducing the need for nuanced reasoning.
The uniformity in probability across Q1/Q2 raises questions about the diversity of the test cases. Further analysis could explore whether the questions are intentionally designed to favor larger models or if the results reflect inherent biases in the training data.