## Bar Charts: LLM Performance Comparison on Two Questions
### Overview
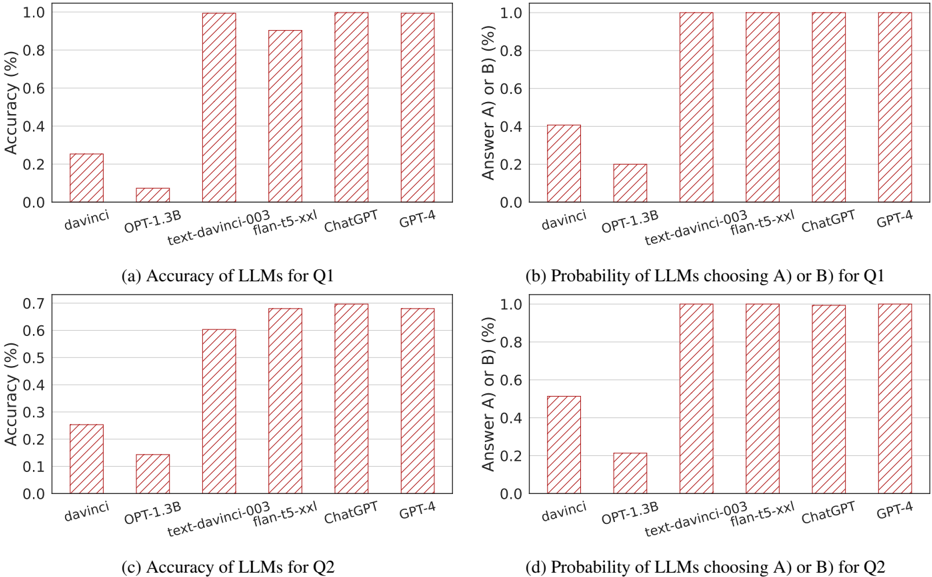
The image contains four separate bar charts arranged in a 2x2 grid. They compare the performance of six different Large Language Models (LLMs) on two distinct questions, labeled Q1 and Q2. The performance is measured by two metrics: accuracy and the probability of choosing answer A or B. All charts use a consistent visual style with red, diagonally hatched bars on a white background with light gray gridlines.
### Components/Axes
**Common Elements Across All Charts:**
* **X-axis (Categorical):** Lists six LLM models. From left to right: `davinci`, `OPT-1.3B`, `text-davinci-003`, `flan-t5-xxl`, `ChatGPT`, `GPT-4`.
* **Y-axis (Numerical):** Represents a percentage, scaled from 0.0 to 1.0 (equivalent to 0% to 100%).
* **Bar Style:** All bars are filled with a red diagonal hatch pattern (`///`).
* **Grid:** Light gray horizontal gridlines are present at 0.2 intervals on the y-axis.
**Individual Chart Labels:**
* **Chart (a) - Top Left:**
* **Title (below chart):** `(a) Accuracy of LLMs for Q1`
* **Y-axis Label:** `Accuracy (%)`
* **Chart (b) - Top Right:**
* **Title (below chart):** `(b) Probability of LLMs choosing A) or B) for Q1`
* **Y-axis Label:** `Answer A) or B) (%)`
* **Chart (c) - Bottom Left:**
* **Title (below chart):** `(c) Accuracy of LLMs for Q2`
* **Y-axis Label:** `Accuracy (%)`
* **Chart (d) - Bottom Right:**
* **Title (below chart):** `(d) Probability of LLMs choosing A) or B) for Q2`
* **Y-axis Label:** `Answer A) or B) (%)`
### Detailed Analysis
**Chart (a): Accuracy of LLMs for Q1**
* **Trend:** Accuracy generally increases from left to right, with a significant jump after the first two models.
* **Data Points (Approximate):**
* `davinci`: ~0.26 (26%)
* `OPT-1.3B`: ~0.08 (8%)
* `text-davinci-003`: ~1.00 (100%)
* `flan-t5-xxl`: ~0.90 (90%)
* `ChatGPT`: ~1.00 (100%)
* `GPT-4`: ~1.00 (100%)
**Chart (b): Probability of LLMs choosing A) or B) for Q1**
* **Trend:** Similar upward trend. The last four models all show a probability of 1.0 (100%), indicating they consistently selected one of the provided answer choices (A or B).
* **Data Points (Approximate):**
* `davinci`: ~0.41 (41%)
* `OPT-1.3B`: ~0.20 (20%)
* `text-davinci-003`: ~1.00 (100%)
* `flan-t5-xxl`: ~1.00 (100%)
* `ChatGPT`: ~1.00 (100%)
* `GPT-4`: ~1.00 (100%)
**Chart (c): Accuracy of LLMs for Q2**
* **Trend:** A clear, steady upward trend from left to right. The overall accuracy ceiling is lower than for Q1 (max ~0.7 vs ~1.0).
* **Data Points (Approximate):**
* `davinci`: ~0.26 (26%)
* `OPT-1.3B`: ~0.15 (15%)
* `text-davinci-003`: ~0.61 (61%)
* `flan-t5-xxl`: ~0.68 (68%)
* `ChatGPT`: ~0.69 (69%)
* `GPT-4`: ~0.68 (68%)
**Chart (d): Probability of LLMs choosing A) or B) for Q2**
* **Trend:** The last four models again show a probability of 1.0 (100%). The first two models have higher probabilities here than in chart (b).
* **Data Points (Approximate):**
* `davinci`: ~0.52 (52%)
* `OPT-1.3B`: ~0.21 (21%)
* `text-davinci-003`: ~1.00 (100%)
* `flan-t5-xxl`: ~1.00 (100%)
* `ChatGPT`: ~1.00 (100%)
* `GPT-4`: ~1.00 (100%)
### Key Observations
1. **Performance Gap:** There is a stark performance divide between the first two models (`davinci`, `OPT-1.3B`) and the latter four (`text-davinci-003` onwards) across all metrics.
2. **Question Difficulty:** Q2 appears to be more difficult than Q1, as the maximum accuracy achieved is lower (~69% vs. 100%).
3. **Answer Choice Bias:** For both questions, the four more advanced models have a 100% probability of selecting either answer A or B. This suggests they are highly confident in choosing from the provided options, whereas the earlier models sometimes fail to select either choice.
4. **Model Progression:** Within the higher-performing group, `text-davinci-003`, `ChatGPT`, and `GPT-4` show very similar, near-perfect accuracy on Q1. For Q2, `ChatGPT` shows a very slight edge in accuracy over the others in its group.
### Interpretation
The data demonstrates a clear evolution in LLM capability. The older base models (`davinci`, `OPT-1.3B`) struggle significantly with both questions, showing low accuracy and a low propensity to even select the given answer choices. This could indicate a failure to understand the task format or a lack of relevant knowledge.
The more advanced instruction-tuned and conversational models (`text-davinci-003`, `flan-t5-xxl`, `ChatGPT`, `GPT-4`) exhibit a dramatic improvement. Their 100% rate of choosing A or B indicates robust task comprehension. The perfect accuracy of three models on Q1 suggests it may be a straightforward factual or logical question within their knowledge domain. The lower, but still strong, accuracy on Q2 implies it is a more challenging problem, possibly requiring nuanced reasoning, specialized knowledge, or being designed to test model limitations. The near-identical performance of the top models on Q2's accuracy metric may indicate a performance plateau or that the question's difficulty ceiling has been reached by current technology. The charts effectively visualize the rapid advancement in LLM performance over successive model generations.