\n
## Diagram: Parameter Estimation Tree
### Overview
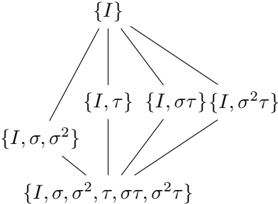
The image depicts a tree-like diagram illustrating a hierarchical process of parameter estimation. The diagram shows how a set of initial parameters expands into more comprehensive sets through successive branching. The diagram is structured with sets of parameters enclosed in curly braces, connected by lines representing the flow of estimation.
### Components/Axes
The diagram consists of nodes representing sets of parameters. The root node is {I}, and the diagram branches downwards, adding parameters at each level. The parameters used are: I, τ (tau), σ (sigma), σ² (sigma squared), and στ (sigma tau). The diagram is arranged in a top-down fashion, with the root at the top-center and subsequent levels branching out below.
### Detailed Analysis or Content Details
The diagram can be described as follows:
1. **Level 1 (Root):** {I}
2. **Level 2:** This level branches from {I} into three sets:
* {I, τ}
* {I, στ}
* {I, σ²τ}
3. **Level 3:** This level branches from {I, τ} and {I, στ}:
* {I, σ, σ²} branches from {I, τ}
4. **Level 4:** This level branches from {I, σ, σ²} and {I, στ}:
* {I, σ, σ², τ, στ, σ²τ} branches from {I, σ, σ²} and {I, στ}.
The lines connecting the nodes indicate the progression of parameter estimation. Each branch represents the addition of a new parameter or a combination of parameters to the existing set.
### Key Observations
The diagram demonstrates a process of iteratively refining parameter estimation. Starting with a single parameter (I), the diagram expands to include additional parameters (τ, σ, σ², στ) and their combinations. The final level represents a complete set of parameters: {I, σ, σ², τ, στ, σ²τ}. The branching structure suggests that the estimation process can follow multiple paths, ultimately converging on a comprehensive set of parameters.
### Interpretation
This diagram likely represents a Bayesian inference or maximum likelihood estimation process for a statistical model. The initial parameter 'I' could represent an initial estimate or a prior belief. The subsequent parameters (τ, σ, σ², στ) represent various aspects of the model's uncertainty or variability. The branching structure illustrates how the estimation process incorporates new information to refine the parameter estimates. The final set of parameters represents the posterior distribution or the maximum likelihood estimates of the model's parameters. The diagram suggests a hierarchical model where parameters are estimated sequentially, building upon previous estimates. The inclusion of interaction terms like στ and σ²τ indicates that the model accounts for correlations between the parameters. This type of diagram is common in statistical modeling and machine learning, particularly in the context of Gaussian processes or hierarchical Bayesian models.