# Technical Document Extraction: Graph Analysis
## Overview
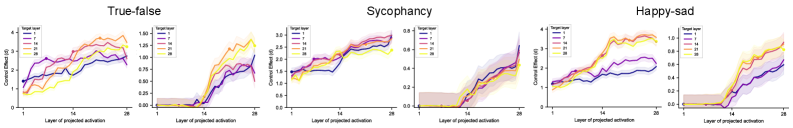
The image contains three pairs of graphs, each pair corresponding to a psychological construct: **True-false**, **Sycophancy**, and **Happy-sad**. Each pair includes:
1. A graph labeled **"Control Effect (σ)"** (left)
2. A graph labeled **"Target layer"** (right)
All graphs share the same x-axis: **"Layer of projected activation"** (ranging from 1 to 28). The y-axes differ between graph types:
- **Control Effect (σ)**: 0 to 4
- **Target layer**: 0 to 1.5
---
## Legend Details
Each graph includes a legend with **five target layers**:
- **Layer 1** (blue)
- **Layer 7** (purple)
- **Layer 14** (pink)
- **Layer 21** (orange)
- **Layer 28** (yellow)
Legend colors are consistent across all graphs.
---
## Key Trends and Data Points
### 1. **True-false**
#### Control Effect (σ)
- **Layer 1**: All lines start near 0.5–1.0.
- **Layer 7**: Lines show moderate increases (1.5–2.5).
- **Layer 14**: Sharp rise to 2.5–3.5.
- **Layer 21**: Peaks at 3.5–4.0.
- **Layer 28**: Slight decline or stabilization (~3.0–3.5).
#### Target Layer
- **Layer 1**: All lines start near 0.0.
- **Layer 7**: Minimal increase (~0.1–0.2).
- **Layer 14**: Gradual rise to ~0.5.
- **Layer 21**: Sharp increase to ~1.0–1.2.
- **Layer 28**: Peaks at ~1.2–1.3.
### 2. **Sycophancy**
#### Control Effect (σ)
- **Layer 1**: Lines start near 1.0–1.5.
- **Layer 7**: Moderate increase (1.5–2.0).
- **Layer 14**: Rise to 2.0–2.5.
- **Layer 21**: Peaks at 2.5–3.0.
- **Layer 28**: Stabilizes (~2.5–3.0).
#### Target Layer
- **Layer 1**: All lines start near 0.0.
- **Layer 7**: Minimal increase (~0.1).
- **Layer 14**: Gradual rise to ~0.4.
- **Layer 21**: Sharp increase to ~0.7–0.8.
- **Layer 28**: Peaks at ~0.8–0.9.
### 3. **Happy-sad**
#### Control Effect (σ)
- **Layer 1**: Lines start near 1.0–1.5.
- **Layer 7**: Moderate increase (1.5–2.0).
- **Layer 14**: Rise to 2.0–2.5.
- **Layer 21**: Peaks at 2.5–3.0.
- **Layer 28**: Stabilizes (~2.5–3.0).
#### Target Layer
- **Layer 1**: All lines start near 0.0.
- **Layer 7**: Minimal increase (~0.1).
- **Layer 14**: Gradual rise to ~0.3.
- **Layer 21**: Sharp increase to ~0.6–0.7.
- **Layer 28**: Peaks at ~0.7–0.8.
---
## Observations
1. **Control Effect (σ)**:
- All constructs show increasing control effect with higher layers.
- **True-false** exhibits the steepest rise, peaking at Layer 21.
- **Sycophancy** and **Happy-sad** show more gradual increases, peaking at Layer 28.
2. **Target Layer**:
- All constructs demonstrate a consistent upward trend across layers.
- **True-false** has the highest target layer values (~1.3 at Layer 28).
- **Sycophancy** and **Happy-sad** show lower but similar trends (~0.9 and ~0.8, respectively).
3. **Variability**:
- Shaded regions (confidence intervals) indicate variability in measurements.
- **True-false** shows the widest variability, especially at Layers 14–21.
---
## Conclusion
The graphs illustrate how control effect and target layer values evolve across projected activation layers for three psychological constructs. **True-false** demonstrates the most pronounced increases, while **Sycophancy** and **Happy-sad** show more moderate trends. These patterns suggest layer-dependent differences in neural processing for these constructs.