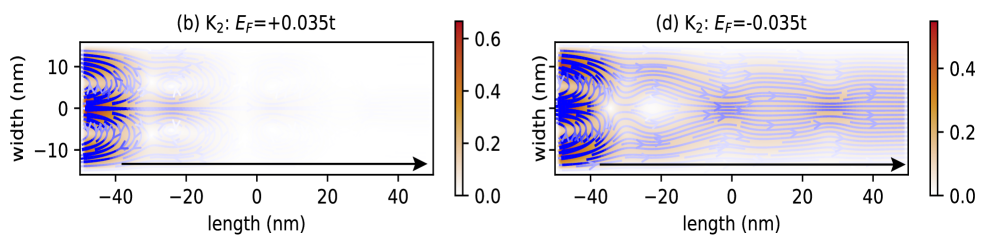
# Technical Document Extraction: Heatmap Analysis of K₂ and E_F Parameters
## Panel (b) - K₂: E_F = +0.035t
### Axis Labels
- **X-axis**: `length (nm)` (direction: left to right)
- **Y-axis**: `width (nm)` (range: -10 nm to +10 nm)
### Color Scale Legend
- **Gradient**: White (0.0) → Red (0.6)
- **Key Observation**:
- High-intensity regions (red) localized near the edges of the plot (left side).
- Gradual decay of intensity toward the center and right side.
### Diagram Components
- **Arrows**: Black arrow on the X-axis indicating increasing length.
- **Color Distribution**:
- Blue-to-red gradient indicates varying intensity values.
- Symmetric patterns observed along the Y-axis (width).
---
## Panel (d) - K₂: E_F = -0.035t
### Axis Labels
- **X-axis**: `length (nm)` (direction: left to right)
- **Y-axis**: `width (nm)` (range: -10 nm to +10 nm)
### Color Scale Legend
- **Gradient**: White (0.0) → Red (0.6)
- **Key Observation**:
- High-intensity regions (red) concentrated near the center (X ≈ 0 nm).
- Oscillatory patterns with alternating intensity bands along the X-axis.
### Diagram Components
- **Arrows**: Black arrow on the X-axis indicating increasing length.
- **Color Distribution**:
- Blue-to-red gradient with periodic intensity variations.
- Asymmetric patterns compared to Panel (b).
---
## Cross-Reference: Legend Colors vs. Diagram
- **Panel (b)**: Red regions align with the highest intensity values (0.6) on the legend.
- **Panel (d)**: Red regions correspond to peak intensity values, with blue regions near 0.0.
## Summary of Trends
1. **Panel (b)**: Edge-localized high-intensity features under positive E_F.
2. **Panel (d)**: Centralized high-intensity features with oscillatory decay under negative E_F.
3. **Color Consistency**: Red = maximum intensity (0.6), White = baseline (0.0) across both panels.