## 2D Contour Plot with Marginal Distributions: General Text vs. Medical Text
### Overview
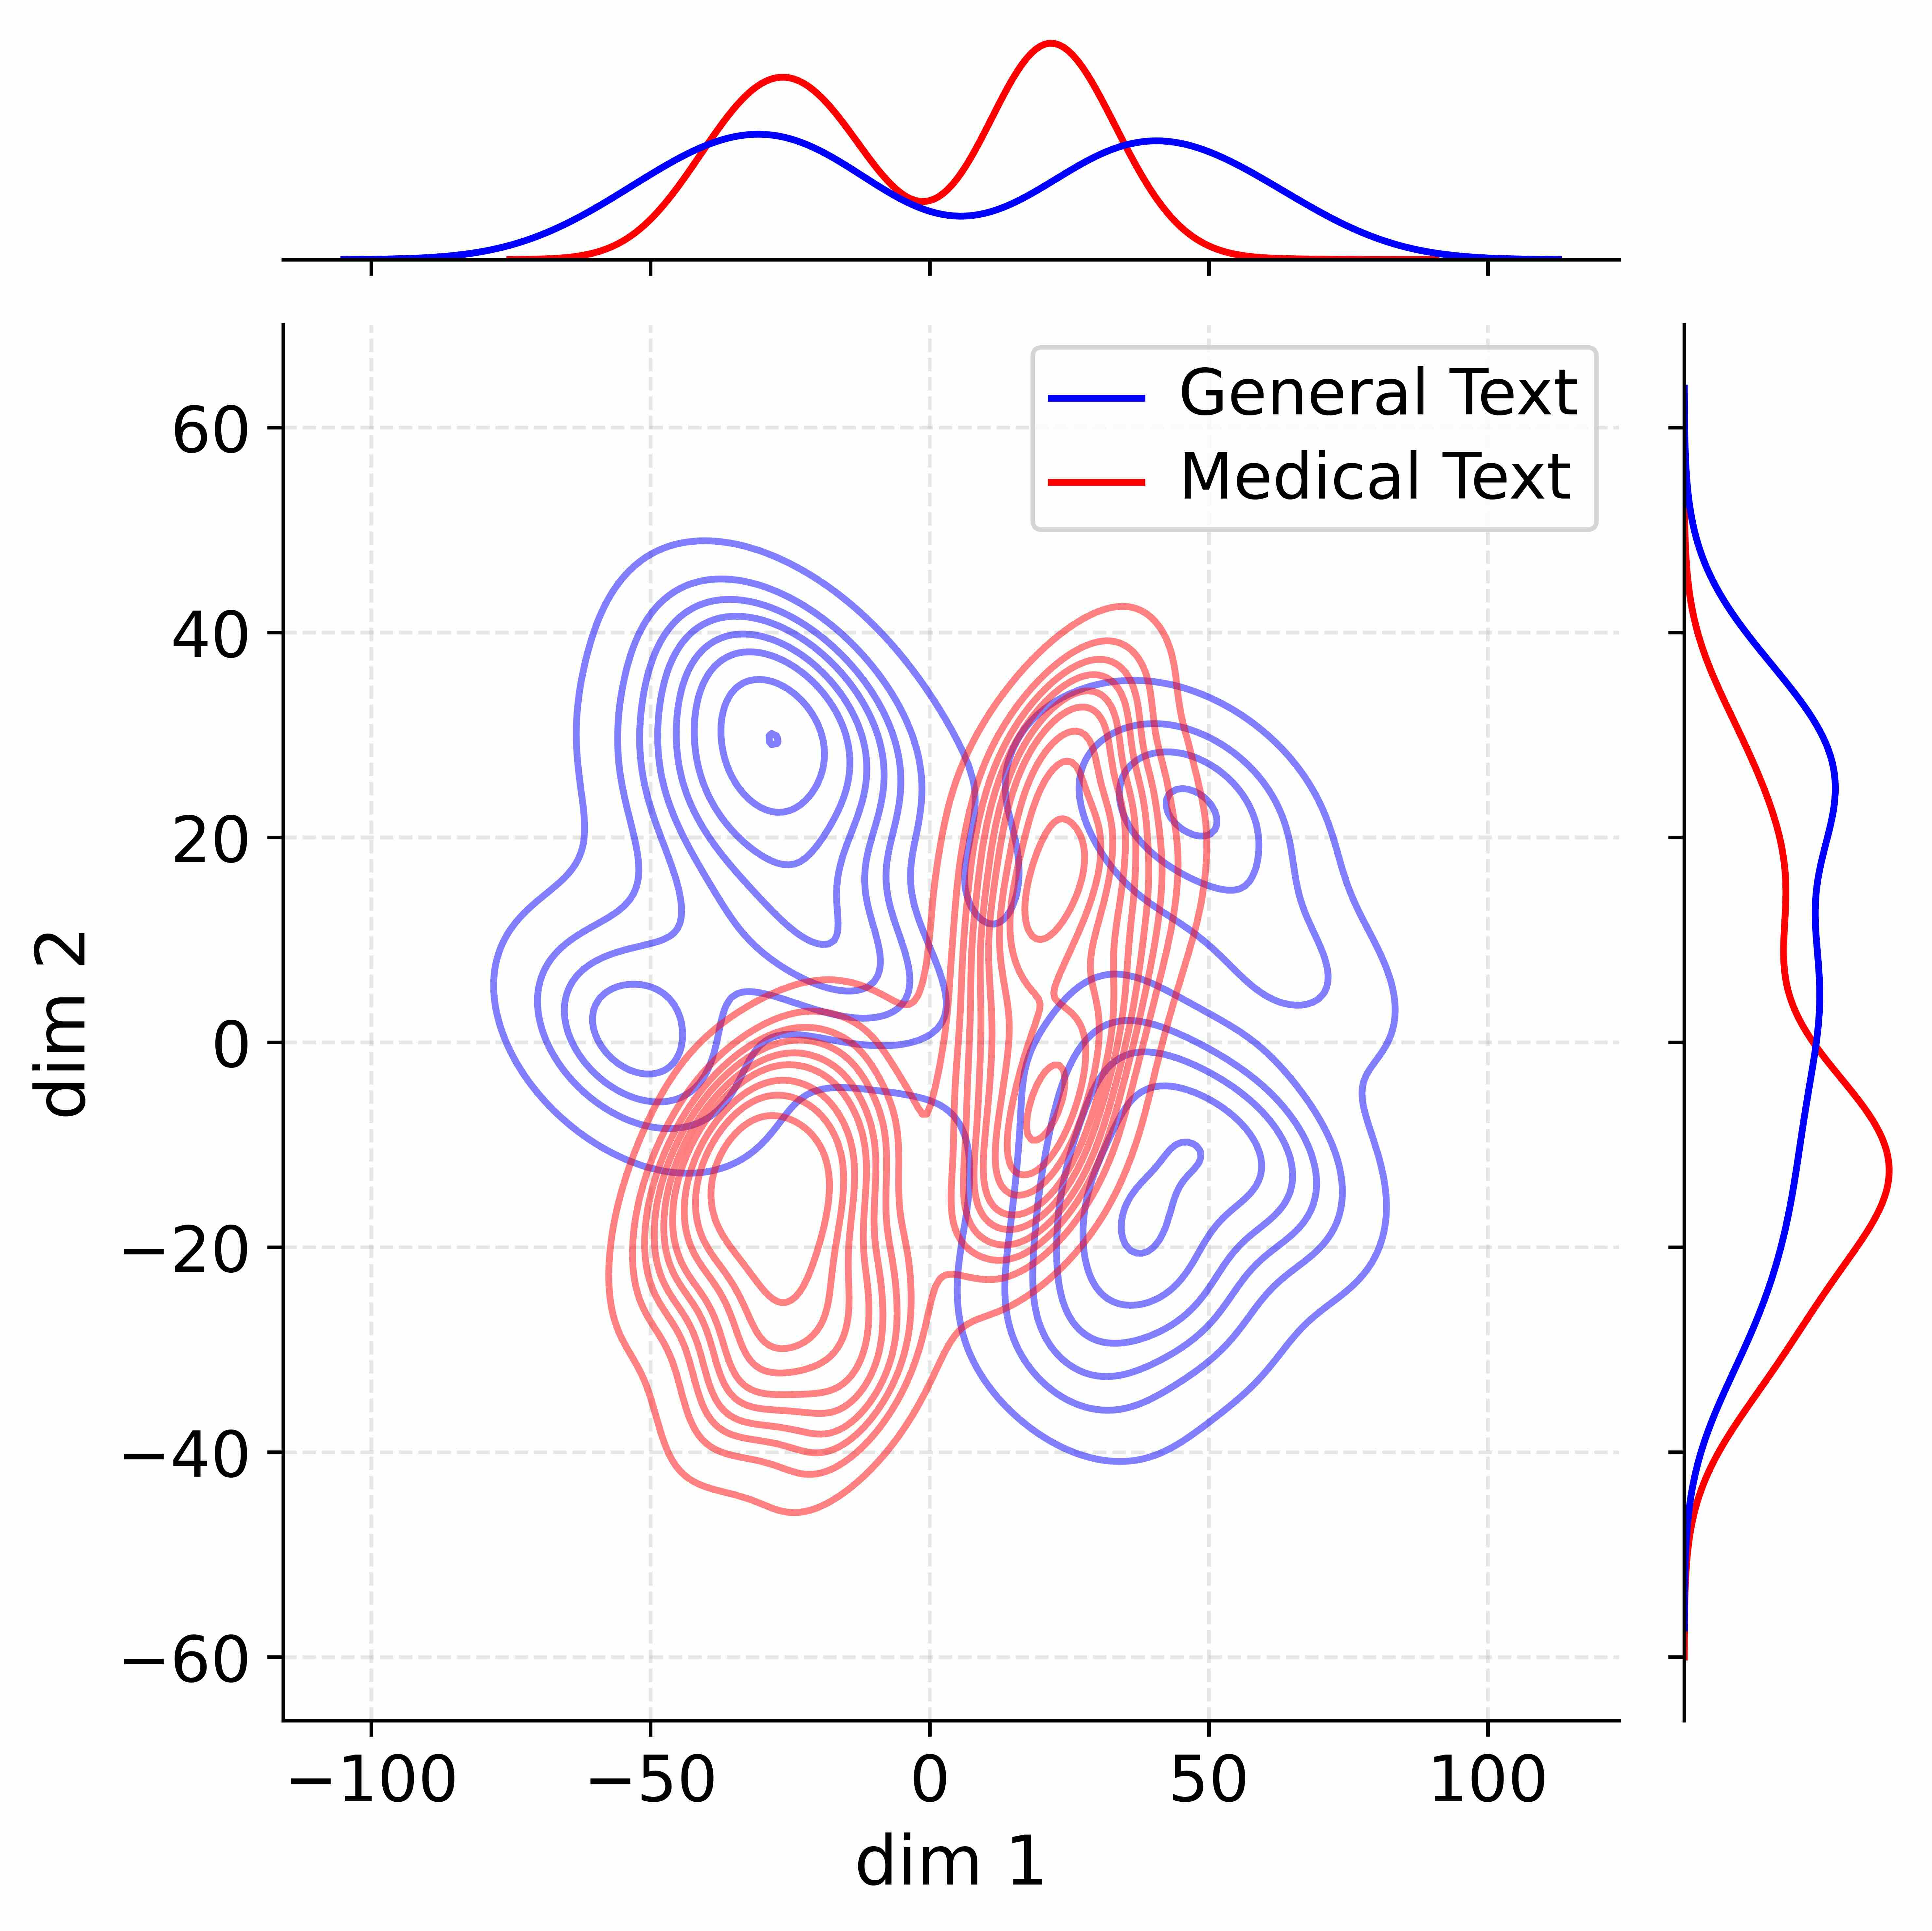
The image is a 2D kernel density estimate (KDE) contour plot comparing the distribution of two datasets, labeled "General Text" and "Medical Text," across two dimensions (`dim 1` and `dim 2`). The plot includes marginal distribution curves along the top (for `dim 1`) and right side (for `dim 2`). The visualization aims to show how the two text types cluster differently in this 2D feature space.
### Components/Axes
* **Main Plot (Center):**
* **X-axis:** Labeled `dim 1`. Scale ranges from approximately -120 to +120, with major tick marks at -100, -50, 0, 50, and 100.
* **Y-axis:** Labeled `dim 2`. Scale ranges from approximately -70 to +70, with major tick marks at -60, -40, -20, 0, 20, 40, and 60.
* **Data Series:** Represented by contour lines.
* **Blue Contours:** Correspond to "General Text" (as per legend).
* **Red Contours:** Correspond to "Medical Text" (as per legend).
* **Legend:** Located in the top-right quadrant of the main plot area. It contains two entries: a blue line labeled "General Text" and a red line labeled "Medical Text".
* **Top Marginal Plot:**
* Shows the 1D density distribution for `dim 1`.
* Contains a blue curve (General Text) and a red curve (Medical Text).
* **Right Marginal Plot:**
* Shows the 1D density distribution for `dim 2`.
* Contains a blue curve (General Text) and a red curve (Medical Text).
### Detailed Analysis
**1. Main Contour Plot (2D Distribution):**
* **General Text (Blue):** Exhibits a **multimodal distribution** with at least three distinct, separated clusters.
* **Cluster 1 (Top-Left):** Centered approximately at (`dim 1` ≈ -30, `dim 2` ≈ 30). This is a dense, roughly circular cluster.
* **Cluster 2 (Bottom-Right):** Centered approximately at (`dim 1` ≈ 30, `dim 2` ≈ -20). This cluster is elongated diagonally.
* **Cluster 3 (Top-Right):** Centered approximately at (`dim 1` ≈ 40, `dim 2` ≈ 20). This cluster is less dense and more diffuse than the others.
* The contours are widely spread, indicating a high variance across both dimensions.
* **Medical Text (Red):** Exhibits a **bimodal distribution** with two primary, connected clusters.
* **Cluster A (Bottom-Left):** Centered approximately at (`dim 1` ≈ -20, `dim 2` ≈ -25). This is a very dense, vertically oriented cluster.
* **Cluster B (Center-Right):** Centered approximately at (`dim 1` ≈ 15, `dim 2` ≈ 10). This cluster is also dense and appears to connect to Cluster A via a narrower band of density.
* The overall spread of the red contours is more compact than the blue, especially along `dim 1`.
**2. Top Marginal Distribution (`dim 1`):**
* **General Text (Blue):** The distribution is broad and appears **trimodal**, with peaks roughly at `dim 1` values of -30, 10, and 50. The peak at -30 is the highest.
* **Medical Text (Red):** The distribution is narrower and **bimodal**, with two sharp peaks at approximately `dim 1` = -20 and `dim 1` = 20. The peak at 20 is the highest.
**3. Right Marginal Distribution (`dim 2`):**
* **General Text (Blue):** The distribution is broad and appears **bimodal**, with peaks at approximately `dim 2` = 30 and `dim 2` = -10.
* **Medical Text (Red):** The distribution is also broad and **bimodal**, with peaks at approximately `dim 2` = 10 and `dim 2` = -30. The peak at -30 is the highest.
### Key Observations
1. **Distinct Clustering:** The two text types form largely separate clusters in the 2D space. The "General Text" clusters are positioned more towards the top-left and right, while the "Medical Text" clusters are positioned more towards the bottom-left and center.
2. **Overlap Region:** There is a region of moderate overlap between the distributions, primarily between the "General Text" cluster at (`dim 1`≈40, `dim 2`≈20) and the "Medical Text" cluster at (`dim 1`≈15, `dim 2`≈10).
3. **Variance Difference:** "General Text" shows greater dispersion (wider spread) across both dimensions compared to the more concentrated "Medical Text."
4. **Marginal Agreement:** The peaks and spreads observed in the 2D contour plot are consistent with the peaks shown in the 1D marginal distributions.
### Interpretation
This plot likely visualizes the output of a dimensionality reduction technique (like PCA or t-SNE) applied to text data, where `dim 1` and `dim 2` represent the two most significant derived features.
* **What the data suggests:** The clear separation indicates that "General Text" and "Medical Text" have fundamentally different statistical properties in this feature space. Medical text appears to be more specialized and consistent (tighter clusters), while general text is more diverse and variable (wider, multiple clusters).
* **Relationship between elements:** The marginal plots confirm the 1D projections of the 2D patterns. The top marginal shows that the most significant difference between the text types occurs along `dim 1`, where medical text has two sharp, distinct modes, while general text is more spread out.
* **Notable patterns/anomalies:** The most striking pattern is the **bimodal vs. multimodal** nature. The two sharp peaks for medical text along `dim 1` could correspond to two distinct sub-domains or styles within medical writing (e.g., clinical reports vs. research articles). The three clusters for general text might represent broad categories like news, fiction, and web content. The region of overlap suggests there may be some texts that share characteristics of both categories.