## 2D Contour Plot: Text Data Distribution Analysis
### Overview
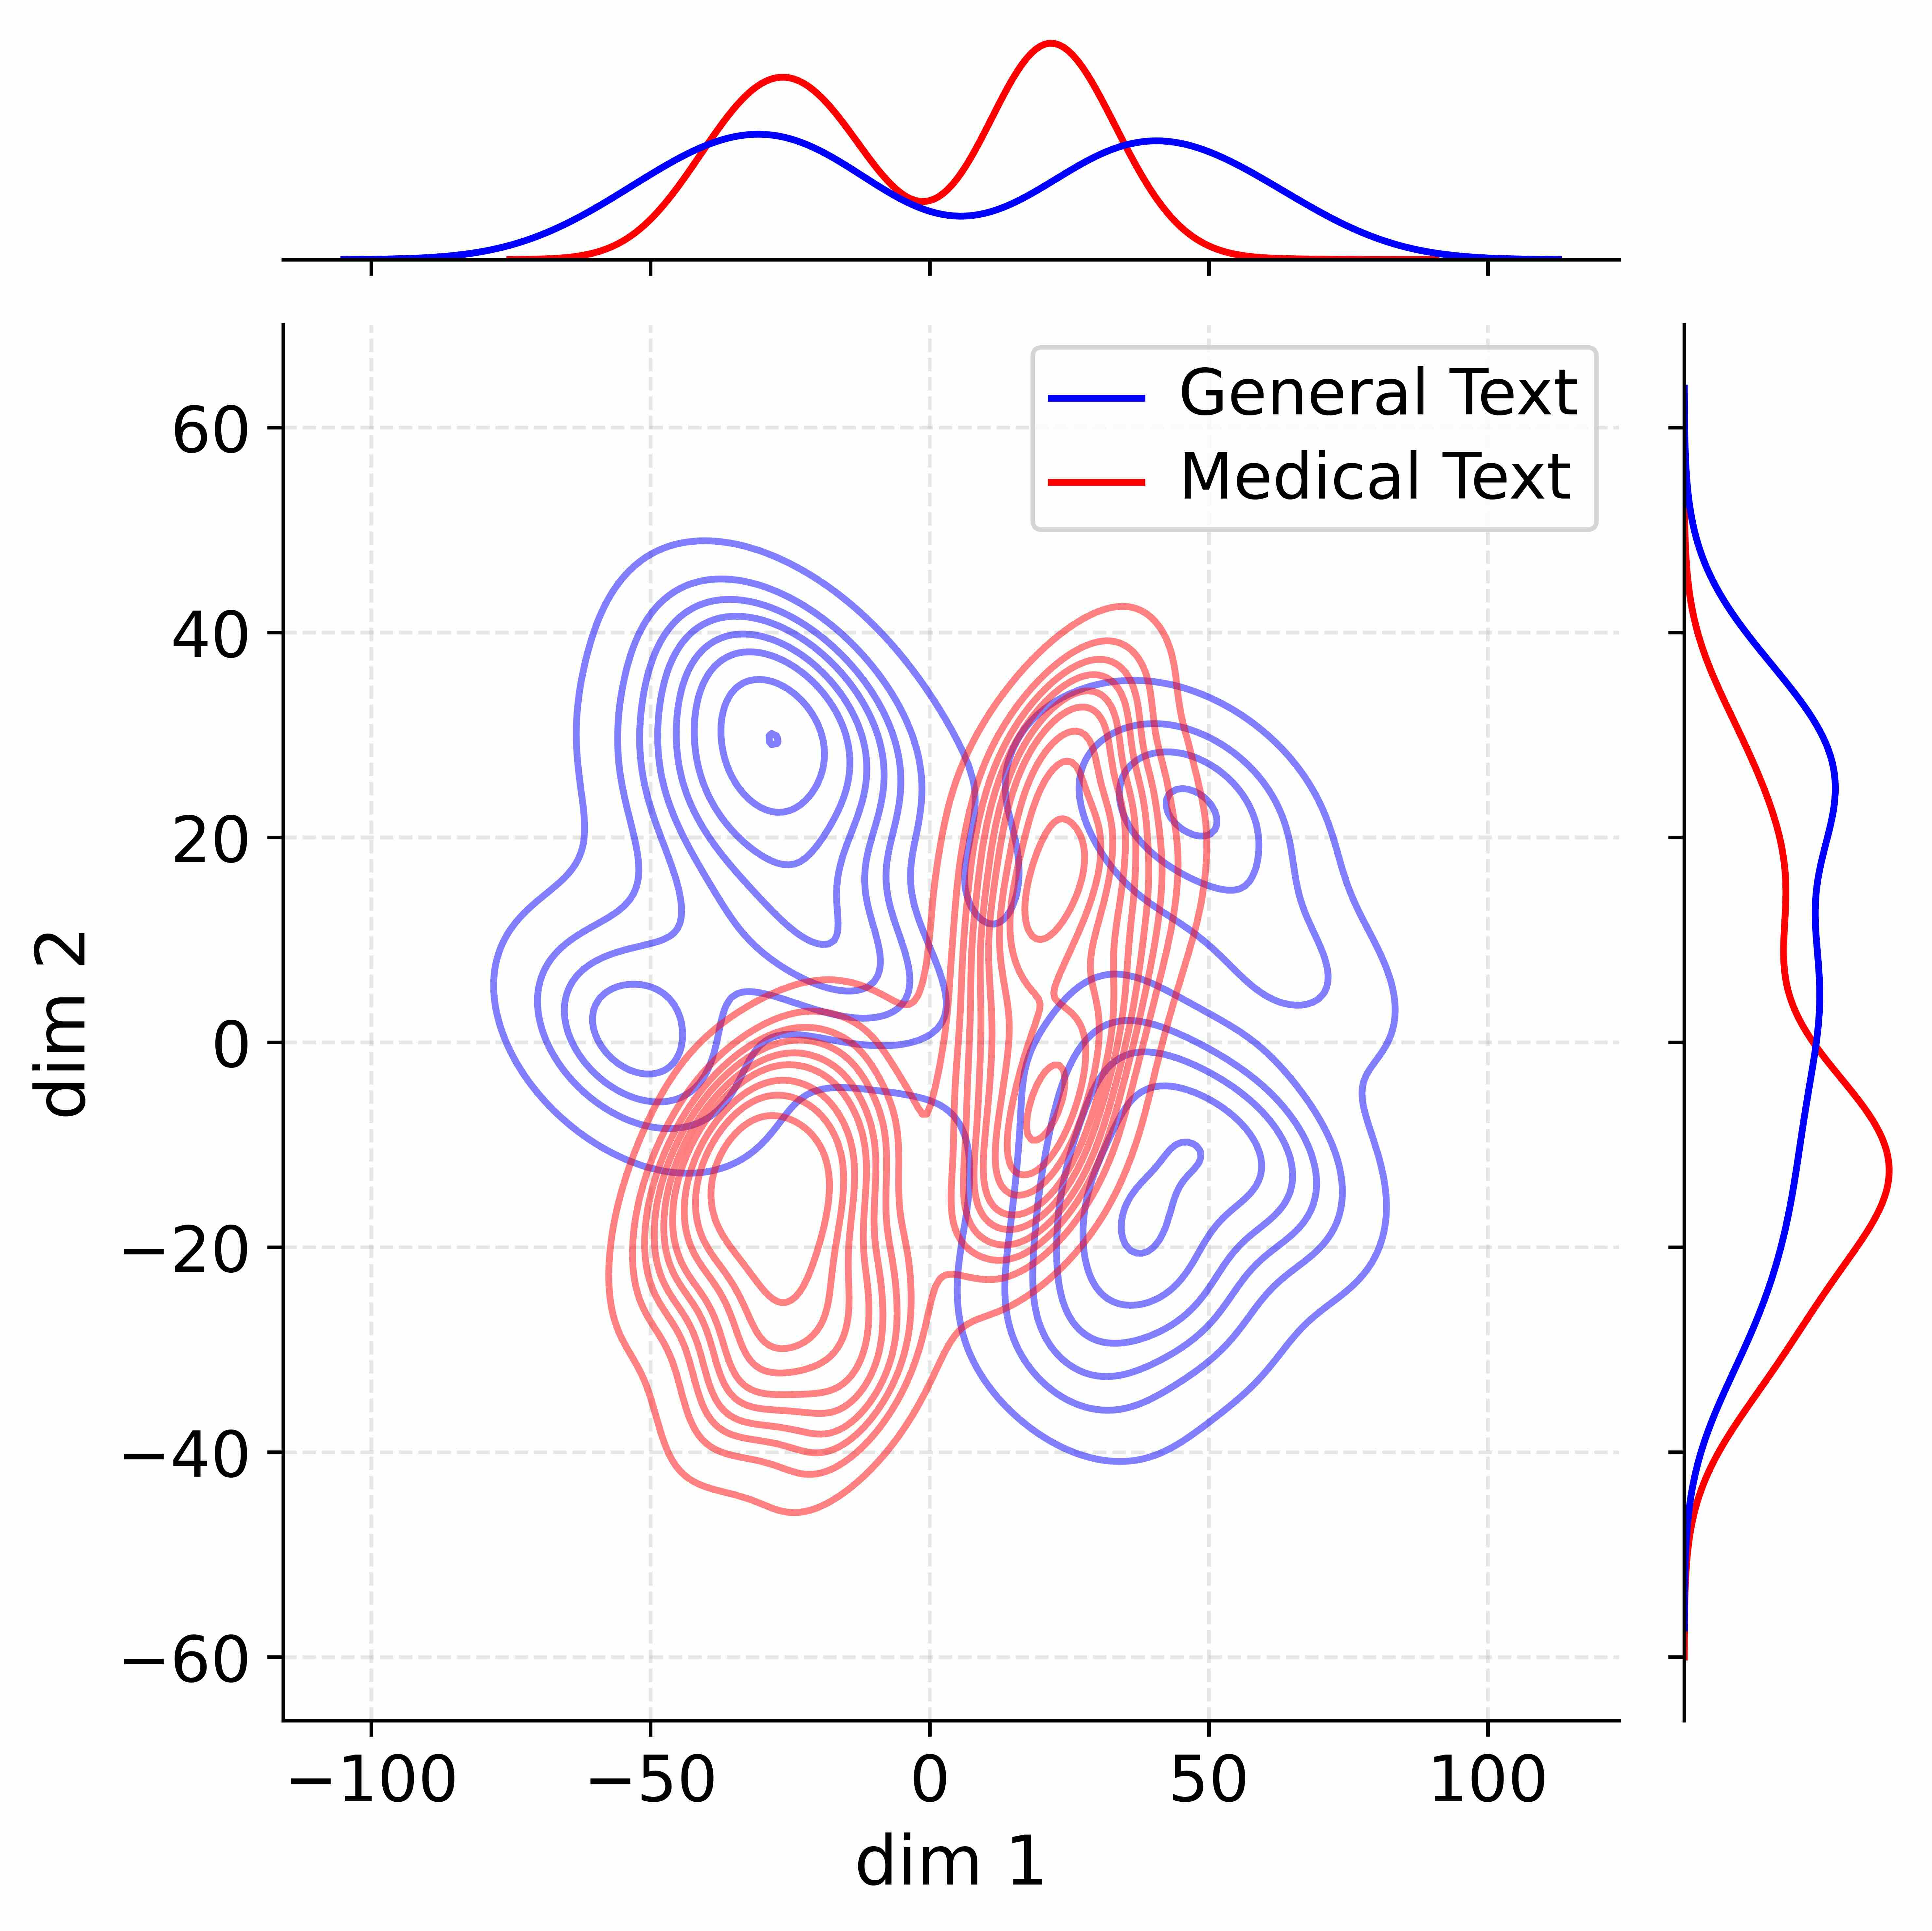
The image presents a 2D contour plot comparing the distribution of two text types (General Text and Medical Text) across two dimensions (dim 1 and dim 2). Marginal histograms on the top and right edges show the univariate distributions of dim 1 and dim 2, respectively. The plot uses contour lines to visualize density regions, with blue representing General Text and red representing Medical Text.
### Components/Axes
- **X-axis (dim 1)**: Ranges from -100 to 100, labeled "dim 1".
- **Y-axis (dim 2)**: Ranges from -60 to 60, labeled "dim 2".
- **Legend**: Located in the top-right corner, with:
- **Blue**: General Text
- **Red**: Medical Text
- **Marginal Histograms**:
- **Top**: Histogram of dim 1 distributions (blue and red overlapping).
- **Right**: Histogram of dim 2 distributions (blue and red separated).
### Detailed Analysis
1. **Contour Plot**:
- **General Text (Blue)**:
- Peaks around **dim 1 = 0**, **dim 2 = 40**.
- Density decreases symmetrically in dim 1 (spread from -50 to 50) and dim 2 (spread from 0 to 60).
- Contour lines form concentric ellipses centered at (0, 40).
- **Medical Text (Red)**:
- Peaks around **dim 1 = 0**, **dim 2 = -20**.
- Density decreases asymmetrically in dim 1 (spread from -50 to 50) and dim 2 (spread from -40 to 0).
- Contour lines form elongated ellipses centered at (0, -20).
2. **Marginal Histograms**:
- **Dim 1 (Top)**:
- Both distributions peak near **dim 1 = 0**.
- Blue (General Text) has a slightly narrower spread (~±50) compared to red (Medical Text, ~±60).
- **Dim 2 (Right)**:
- Blue peaks at **dim 2 = 40** with a sharp decline beyond ±20.
- Red peaks at **dim 2 = -20** with a gradual decline toward ±40.
### Key Observations
1. **Dimensional Separation**:
- General Text clusters in the **positive dim 2** region, while Medical Text clusters in the **negative dim 2** region.
- Overlap occurs in dim 1 but minimal overlap in dim 2, suggesting dim 2 is a stronger discriminator.
2. **Density Patterns**:
- General Text has higher density near its peak (dim 2 = 40) compared to Medical Text (dim 2 = -20).
- Medical Text shows broader variability in dim 1 (±60 vs. ±50 for General Text).
3. **Marginal Distributions**:
- Dim 1 distributions are bimodal but centered at 0 for both text types.
- Dim 2 distributions are unimodal, with clear separation between text types.
### Interpretation
The data suggests two distinct clusters in the 2D space:
- **General Text** is characterized by higher values in dim 2 (~40), potentially indicating a feature like syntactic complexity or domain-specific terminology.
- **Medical Text** is characterized by lower values in dim 2 (~-20), possibly reflecting simpler syntax or domain-agnostic language.
- The marginal histograms confirm that dim 2 is the primary axis for distinguishing the two text types, while dim 1 captures shared variability (e.g., general linguistic patterns).
The separation in dim 2 implies that this dimension could represent a latent feature (e.g., technicality, readability) that differentiates General and Medical Text. The overlap in dim 1 suggests shared characteristics (e.g., sentence length, vocabulary diversity) that are not text-type-specific.