## Line Graph: L2-Norm Analysis Across Dimensions
### Overview
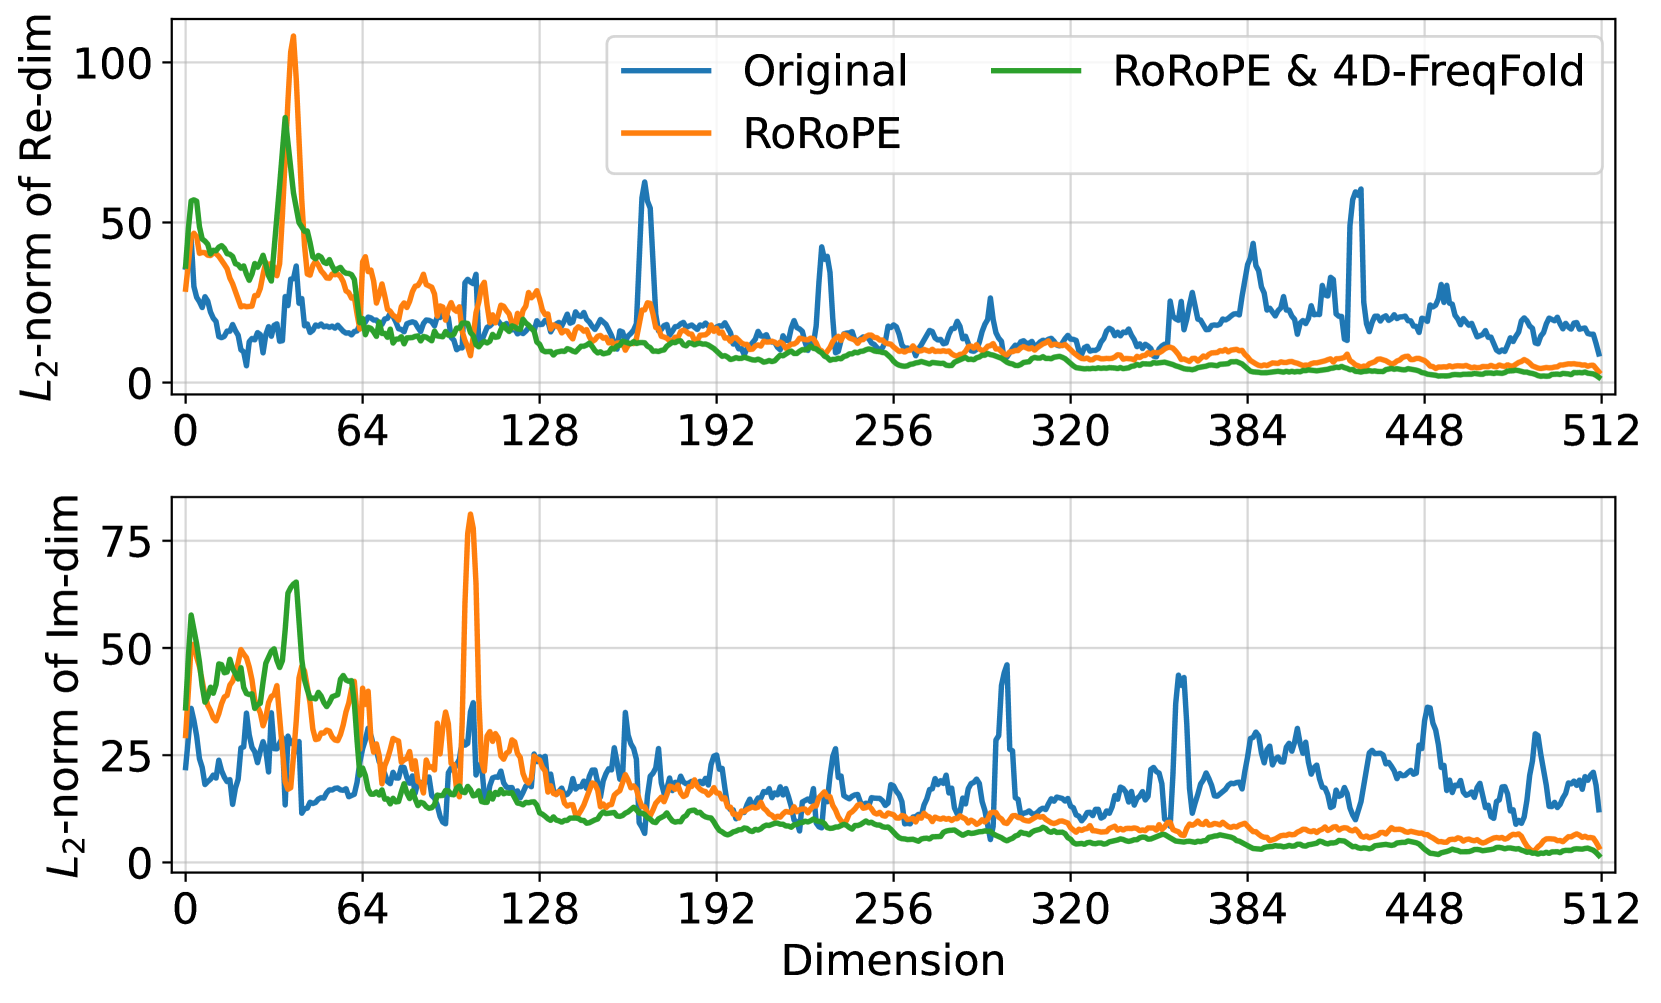
The image contains two vertically stacked line graphs comparing the L2-norm of real and imaginary dimensions across 512 dimensions. Three data series are plotted: "Original" (blue), "RoRoPE" (orange), and "RoRoPE & 4D-FreqFold" (green). The graphs show fluctuating values with distinct peaks and troughs, suggesting dimensional variability in the measured norms.
### Components/Axes
- **X-axis (Top/Bottom Subplots)**: Labeled "Dimension" with ticks at 0, 64, 128, 192, 256, 320, 384, 448, and 512.
- **Y-axis (Top Subplot)**: Labeled "L2-norm of Re-dim" with values ranging from 0 to 100.
- **Y-axis (Bottom Subplot)**: Labeled "L2-norm of Im-dim" with values ranging from 0 to 75.
- **Legend**: Located in the top-right corner of the top subplot, with three entries:
- Blue: "Original"
- Orange: "RoRoPE"
- Green: "RoRoPE & 4D-FreqFold"
### Detailed Analysis
#### Top Subplot (Real Dimensions)
- **Original (Blue)**: Dominates with sharp peaks (e.g., ~80 at dimension 64, ~90 at 192, ~70 at 384). Values drop to ~10–20 between peaks.
- **RoRoPE (Orange)**: Smoother curve with smaller peaks (e.g., ~40 at 64, ~30 at 192, ~20 at 384). Fluctuates between ~5–30.
- **RoRoPE & 4D-FreqFold (Green)**: Most stable, with minimal peaks (e.g., ~20 at 64, ~15 at 192, ~10 at 384). Fluctuates between ~2–15.
#### Bottom Subplot (Imaginary Dimensions)
- **Original (Blue)**: Peaks at ~60 (dimension 64), ~50 (192), and ~40 (384). Drops to ~5–15 between peaks.
- **RoRoPE (Orange)**: Reduced peaks (e.g., ~30 at 64, ~20 at 192, ~10 at 384). Fluctuates between ~5–20.
- **RoRoPE & 4D-FreqFold (Green)**: Near-flat line with values ~5–10 across all dimensions.
### Key Observations
1. **Original Data**: Exhibits high variability with pronounced spikes in both real and imaginary dimensions, particularly at dimensions 64, 192, and 384.
2. **RoRoPE**: Reduces peak magnitudes by ~50% compared to Original but retains moderate fluctuations.
3. **Combined Method (RoRoPE + 4D-FreqFold)**: Achieves the lowest L2-norm values, with near-flat lines in the imaginary dimension subplot and minimal peaks in the real dimension subplot.
4. **Dimensional Correlation**: Peaks in the Original data align across both subplots, suggesting shared dimensional dependencies.
### Interpretation
The data demonstrates that the "RoRoPE & 4D-FreqFold" method significantly stabilizes L2-norm values compared to the Original and RoRoPE alone. The Original data’s spikes may indicate noise, artifacts, or high-dimensional dependencies that the combined method mitigates. The RoRoPE method acts as an intermediate step, reducing but not eliminating variability. This suggests that 4D-FreqFold introduces regularization or dimensionality reduction, critical for applications requiring stable norm distributions (e.g., signal processing, machine learning). The alignment of peaks in the Original data implies that dimensional interactions are a key factor in the observed variability.