## Bar Chart: Rouge-L Scores for Agent and Explore
### Overview
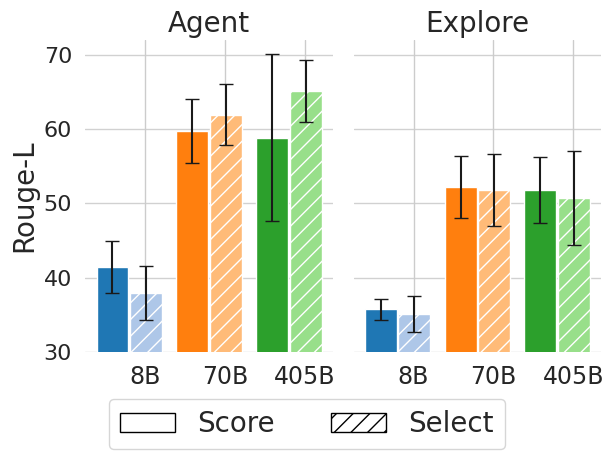
The image presents a bar chart comparing Rouge-L scores for two categories: "Agent" and "Explore." Each category is further divided into three sub-categories: "8B," "70B," and "405B." Within each sub-category, there are two bars representing "Score" and "Select." The chart includes error bars indicating the variability in the scores.
### Components/Axes
* **Title:** The chart is divided into two sections, titled "Agent" (left) and "Explore" (right).
* **Y-axis:** Labeled "Rouge-L," with a numerical scale ranging from 30 to 70 in increments of 10.
* **X-axis:** Categorical, with labels "8B," "70B," and "405B" for both "Agent" and "Explore."
* **Legend:** Located at the bottom of the chart.
* "Score" is represented by solid color bars: blue for 8B, orange for 70B, and green for 405B.
* "Select" is represented by hatched bars: light blue for 8B, light orange for 70B, and light green for 405B.
### Detailed Analysis
**Agent Category:**
* **8B:**
* Score (blue): Approximately 41 with error bars extending from ~37 to ~45.
* Select (light blue, hatched): Approximately 38 with error bars extending from ~34 to ~42.
* **70B:**
* Score (orange): Approximately 60 with error bars extending from ~56 to ~64.
* Select (light orange, hatched): Approximately 62 with error bars extending from ~58 to ~66.
* **405B:**
* Score (green): Approximately 59 with error bars extending from ~46 to ~72.
* Select (light green, hatched): Approximately 65 with error bars extending from ~52 to ~78.
**Explore Category:**
* **8B:**
* Score (blue): Approximately 36 with error bars extending from ~32 to ~40.
* Select (light blue, hatched): Approximately 35 with error bars extending from ~31 to ~39.
* **70B:**
* Score (orange): Approximately 52 with error bars extending from ~48 to ~56.
* Select (light orange, hatched): Approximately 52 with error bars extending from ~48 to ~56.
* **405B:**
* Score (green): Approximately 52 with error bars extending from ~48 to ~56.
* Select (light green, hatched): Approximately 51 with error bars extending from ~47 to ~55.
### Key Observations
* In the "Agent" category, both "Score" and "Select" generally increase as the model size increases from 8B to 70B, but the 405B "Score" decreases slightly.
* In the "Explore" category, the "Score" and "Select" values are relatively similar across all model sizes (8B, 70B, and 405B).
* The error bars are generally larger for the "Agent" category, especially for the 405B model, indicating greater variability in the Rouge-L scores.
### Interpretation
The chart compares the Rouge-L scores of "Agent" and "Explore" methods across different model sizes (8B, 70B, 405B) using "Score" and "Select" metrics. The "Agent" category shows a more pronounced increase in performance with larger model sizes, while the "Explore" category remains relatively stable. The larger error bars for the "Agent" category, particularly with the 405B model, suggest that the performance of the "Agent" method may be more sensitive to variations in the data or experimental setup. The "Select" method generally performs slightly better than the "Score" method, especially for the "Agent" category with larger models.