## Bar Chart: Rouge-L Scores for Agent and Explore Models
### Overview
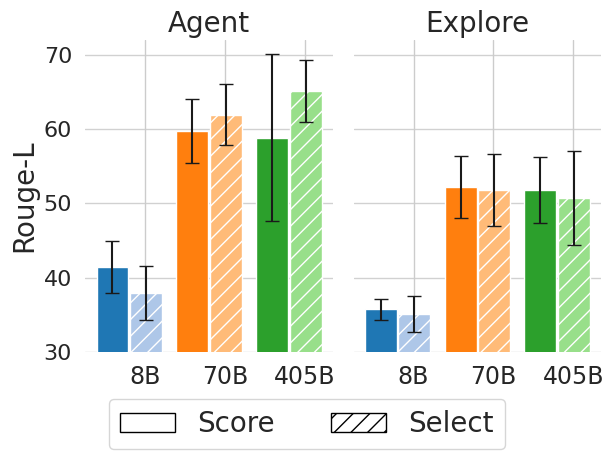
This bar chart compares the Rouge-L scores of two models, "Agent" and "Explore", across three different model sizes: 8B, 70B, and 405B. Each model size has two bars representing "Score" and "Select", with error bars indicating variance. The y-axis represents the Rouge-L score, and the x-axis represents the model size.
### Components/Axes
* **Title:** The chart is divided into two sections labeled "Agent" and "Explore".
* **Y-axis:** "Rouge-L" with a scale ranging from 30 to 70, incrementing by 10.
* **X-axis:** Model sizes: "8B", "70B", and "405B".
* **Legend:** Located at the bottom-center of the chart.
* "Score" - represented by a white fill and a solid border.
* "Select" - represented by a diagonal striped fill.
* **Error Bars:** Black vertical lines extending above and below each bar, indicating the standard deviation or confidence interval.
### Detailed Analysis
The chart consists of six groups of bars, three for "Agent" and three for "Explore", each with two bars representing "Score" and "Select".
**Agent:**
* **8B:**
* Score: Approximately 41, with an error bar ranging from roughly 37 to 45.
* Select: Approximately 38, with an error bar ranging from roughly 34 to 42.
* **70B:**
* Score: Approximately 63, with an error bar ranging from roughly 59 to 67.
* Select: Approximately 60, with an error bar ranging from roughly 56 to 64.
* **405B:**
* Score: Approximately 65, with an error bar ranging from roughly 61 to 69.
* Select: Approximately 63, with an error bar ranging from roughly 59 to 67.
**Explore:**
* **8B:**
* Score: Approximately 34, with an error bar ranging from roughly 30 to 38.
* Select: Approximately 32, with an error bar ranging from roughly 28 to 36.
* **70B:**
* Score: Approximately 55, with an error bar ranging from roughly 51 to 59.
* Select: Approximately 52, with an error bar ranging from roughly 48 to 56.
* **405B:**
* Score: Approximately 57, with an error bar ranging from roughly 53 to 61.
* Select: Approximately 54, with an error bar ranging from roughly 50 to 58.
### Key Observations
* For both "Agent" and "Explore", the Rouge-L scores generally increase with model size.
* The "Agent" model consistently achieves higher Rouge-L scores than the "Explore" model across all model sizes.
* The difference in scores between "Score" and "Select" is relatively small for each model size and for both models.
* The error bars indicate a significant amount of variance in the scores, particularly for the smaller model sizes (8B).
### Interpretation
The data suggests that increasing model size improves Rouge-L scores for both the "Agent" and "Explore" models. The "Agent" model consistently outperforms the "Explore" model, indicating that it is a more effective model for the task being evaluated (likely text generation or summarization, given the use of Rouge-L). The error bars suggest that the results may not be statistically significant for the smaller model sizes due to the high variance. The relatively small difference between "Score" and "Select" suggests that the method used to select the best output does not significantly impact the Rouge-L score. The Rouge-L metric is a recall-focused metric for evaluating text summarization or machine translation by counting overlapping n-grams between the generated text and the reference text. Higher Rouge-L scores indicate better overlap and, therefore, better quality. The chart demonstrates a clear positive correlation between model size and performance, as measured by Rouge-L.