## Grouped Bar Chart: Agent vs. Explore Performance by Model Size
### Overview
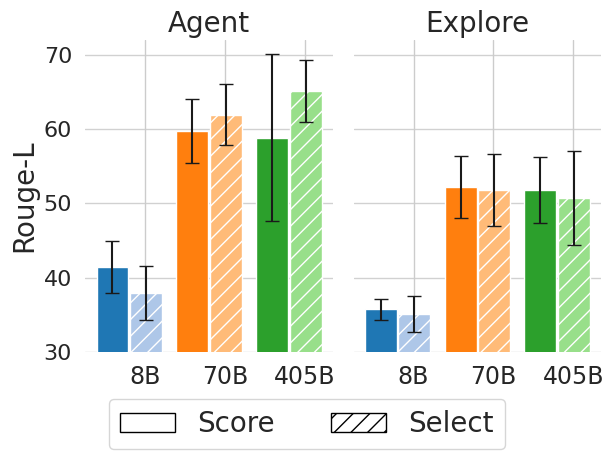
The image displays a grouped bar chart comparing the performance of two different methods or tasks, labeled "Agent" and "Explore," across three different model sizes (8B, 70B, 405B). Performance is measured by the "Rouge-L" metric. Each model size has two bars representing "Score" and "Select" conditions.
### Components/Axes
* **Chart Type:** Grouped bar chart with error bars.
* **Panels:** Two distinct panels side-by-side.
* **Left Panel Title:** "Agent"
* **Right Panel Title:** "Explore"
* **Y-Axis:**
* **Label:** "Rouge-L"
* **Scale:** Linear, ranging from 30 to 70, with major gridlines at intervals of 10 (30, 40, 50, 60, 70).
* **X-Axis (within each panel):** Model sizes.
* **Categories:** "8B", "70B", "405B"
* **Legend:** Located at the bottom center of the entire figure.
* **Solid Fill Box:** Labeled "Score"
* **Hatched Fill Box (diagonal lines):** Labeled "Select"
* **Bar Colors (by model size):**
* **8B:** Blue
* **70B:** Orange
* **405B:** Green
### Detailed Analysis
**Panel: Agent**
* **8B Model:**
* **Score (Solid Blue):** Approximately 41. Error bar spans roughly from 38 to 44.
* **Select (Hatched Blue):** Approximately 38. Error bar spans roughly from 35 to 41.
* **70B Model:**
* **Score (Solid Orange):** Approximately 60. Error bar spans roughly from 56 to 64.
* **Select (Hatched Orange):** Approximately 62. Error bar spans roughly from 58 to 66.
* **405B Model:**
* **Score (Solid Green):** Approximately 59. Error bar spans roughly from 48 to 70 (very large range).
* **Select (Hatched Green):** Approximately 65. Error bar spans roughly from 61 to 69.
**Panel: Explore**
* **8B Model:**
* **Score (Solid Blue):** Approximately 36. Error bar spans roughly from 35 to 37.
* **Select (Hatched Blue):** Approximately 35. Error bar spans roughly from 33 to 37.
* **70B Model:**
* **Score (Solid Orange):** Approximately 52. Error bar spans roughly from 48 to 56.
* **Select (Hatched Orange):** Approximately 51. Error bar spans roughly from 47 to 55.
* **405B Model:**
* **Score (Solid Green):** Approximately 52. Error bar spans roughly from 48 to 56.
* **Select (Hatched Green):** Approximately 50. Error bar spans roughly from 45 to 55.
### Key Observations
1. **Performance Trend with Model Size:** In the "Agent" panel, both "Score" and "Select" show a clear upward trend as model size increases from 8B to 70B to 405B. In the "Explore" panel, performance increases from 8B to 70B but then plateaus or slightly decreases for the 405B model.
2. **Score vs. Select Comparison:**
* In the "Agent" panel, the "Select" (hatched) bar is consistently higher than the "Score" (solid) bar for each corresponding model size.
* In the "Explore" panel, the "Score" and "Select" bars are very close in height for each model size, with no consistent advantage for either condition.
3. **Variability (Error Bars):** The error bars for the "Agent" panel, particularly for the 405B model's "Score" condition, are notably larger than those in the "Explore" panel. This indicates greater variability or uncertainty in the "Agent" task results.
4. **Absolute Performance:** The "Agent" task achieves higher peak Rouge-L scores (up to ~65) compared to the "Explore" task (peak ~52).
### Interpretation
The data suggests a fundamental difference in how model scaling affects performance on the "Agent" versus "Explore" tasks.
* **Agent Task:** This task benefits significantly from increased model scale. The consistent superiority of the "Select" condition over "Score" implies that a selection-based approach within the agent framework is more effective than a scoring-based one, and this advantage grows with model capability. The large error bar for the 405B "Score" suggests that while the model has high potential, its performance in this specific mode is unstable.
* **Explore Task:** Performance improves when scaling from a small (8B) to a medium (70B) model but shows diminishing returns or even a slight regression at the largest (405B) scale. The negligible difference between "Score" and "Select" indicates that the method of evaluation or action selection is not a critical factor for this task. The lower overall scores and smaller error bars suggest the "Explore" task may be inherently more constrained or less responsive to raw model scale than the "Agent" task.
**In summary,** the chart demonstrates that model scaling is highly task-dependent. The "Agent" task appears to be a "scaling-friendly" problem where larger models and specific strategies ("Select") yield substantial gains, while the "Explore" task hits a performance ceiling earlier, and the choice of strategy is less impactful.